
Page 461 - Advanced thermodynamics for engineers
P. 461
452 CHAPTER 19 PINCH TECHNOLOGY
Q h
Q h 1
Q 1
2
300 Q 2
270 3
235 Q 3
4
220
Q 4
205 5 Q 5
Temperatures (K) 150 6 7 Q 6
195
140
95
85 8 Q 7
Q 8
65 9
55 Q 9
10
40
Q 10
11
Q c 12 Q 11
Q c
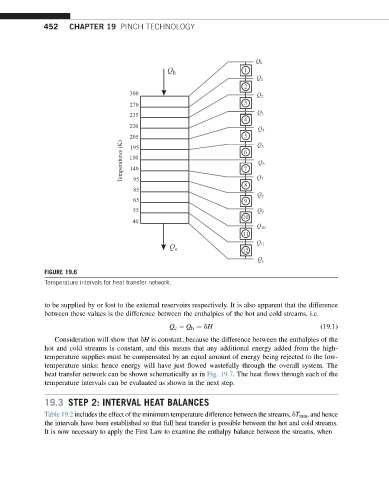
FIGURE 19.6
Temperature intervals for heat transfer network.
to be supplied by or lost to the external reservoirs respectively. It is also apparent that the difference
between these values is the difference between the enthalpies of the hot and cold streams, i.e.
Q c Q h ¼ dH (19.1)
Consideration will show that dH is constant, because the difference between the enthalpies of the
hot and cold streams is constant, and this means that any additional energy added from the high-
temperature supplies must be compensated by an equal amount of energy being rejected to the low-
temperature sinks: hence energy will have just flowed wastefully through the overall system. The
heat transfer network can be shown schematically as in Fig. 19.7. The heat flows through each of the
temperature intervals can be evaluated as shown in the next step.
19.3 STEP 2: INTERVAL HEAT BALANCES
Table 19.2 includes the effect of the minimum temperature difference between the streams, dT min , and hence
the intervals have been established so that full heat transfer is possible between the hot and cold streams.
It is now necessary to apply the First Law to examine the enthalpy balance between the streams, when