
Page 210 - Advances in Biomechanics and Tissue Regeneration
P. 210
10.2 HOMOGENIZATION TECHNIQUE 205
/2 /2
200 100
150 80 10
60
100
40 5
50 20
0 0 0 0 0 0
/6 /6 /6 /6 /6 /6
/3 /3 /3 /3 /3
/2 /2 /2
(A) (B) (C)
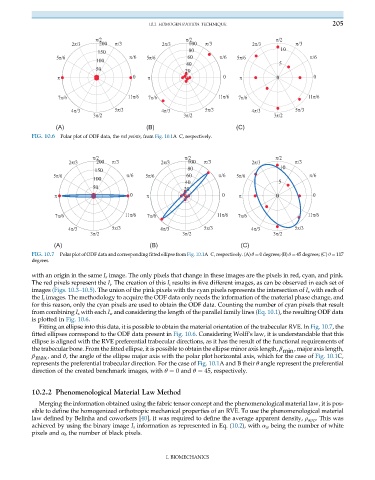
FIG. 10.6 Polar plot of ODF data, the red points, from Fig. 10.1A–C, respectively.
/3 200 /3 100
150 80 10
60
100
40 5
50 20
0 0 0 0 0 0
7 /6 /6 7 /6 /6 7 /6 /6
/3 5 /3 /3 5 /3 /3 5 /3
(A) (B) (C)
FIG. 10.7 Polar plot of ODF data and corresponding fitted ellipse from Fig. 10.1A–C, respectively. (A) θ ¼ 0 degrees; (B) θ ¼ 45 degrees; (C) θ ¼ 117
degrees.
with an origin in the same I s image. The only pixels that change in these images are the pixels in red, cyan, and pink.
The red pixels represent the I ι . The creation of this I ι results in five different images, as can be observed in each set of
images (Figs. 10.3–10.5). The union of the pink pixels with the cyan pixels represents the intersection of I s with each of
the I ι images. The methodology to acquire the ODF data only needs the information of the material phase change, and
for this reason, only the cyan pixels are used to obtain the ODF data. Counting the number of cyan pixels that result
from combining I s with each I ι , and considering the length of the parallel family lines (Eq. 10.1), the resulting ODF data
is plotted in Fig. 10.6.
Fitting an ellipse into this data, it is possible to obtain the material orientation of the trabecular RVE. In Fig. 10.7, the
fitted ellipses correspond to the ODF data present in Fig. 10.6. Considering Wolff’s law, it is understandable that this
ellipse is aligned with the RVE preferential trabecular directions, as it has the result of the functional requirements of
the trabecular bone. From the fitted ellipse, it is possible to obtain the ellipse minor axis length, β min , major axis length,
β max , and θ, the angle of the ellipse major axis with the polar plot horizontal axis, which for the case of Fig. 10.1C,
represents the preferential trabecular direction. For the case of Fig. 10.1A and B their θ angle represent the preferential
direction of the created benchmark images, with θ ¼ 0 and θ ¼ 45, respectively.
10.2.2 Phenomenological Material Law Method
Merging the information obtained using the fabric tensor concept and the phenomenological material law, it is pos-
sible to define the homogenized orthotropic mechanical properties of an RVE. To use the phenomenological material
law defined by Belinha and coworkers [40], it was required to define the average apparent density, ρ app . This was
achieved by using the binary image I s information as represented in Eq. (10.2), with α w being the number of white
pixels and α b the number of black pixels.
I. BIOMECHANICS