
Page 208 - Advances in Biomechanics and Tissue Regeneration
P. 208
10.2 HOMOGENIZATION TECHNIQUE 203
Some of the models and methodologies presented in this chapter analyze structures like bone, which has an under-
lying microstructure. The behavior of the structure at its microscale significantly influences the behavior of the structure
observed at the macroscale. Finding the relation across scales will allow developing multiscale models capable of pre-
dicting the behavior of the macroscale using the microscale, and vice versa. Homogenization techniques allow homog-
enizing the mechanical properties of the heterogeneous material under study, thereby allowing substituting this
material with an equivalent homogeneous material. This homogenization can be integrated into multiscale methods
allowing us to define, for example, the mechanical properties of a highly complex microstructure such as trabecular
bone, and replacing this microstructure by a simple structure with equivalent mechanical proprieties. This simplifica-
tion allows relating the multiscales and simplifying the problem complexity, solving it at the macroscale [103].
The main objective of this chapter is to show how it is possible to combine a new homogenization technique (applied
to the trabecular bone microscale) with meshless methods, aiming to achieve a low-cost and efficient multiscale
technique.
10.2 HOMOGENIZATION TECHNIQUE
In this section, the homogenization technique that allows expeditiously defining the homogenized mechanical
properties of trabecular bone at its microscale is fully described. This technique allows defining the mechanical prop-
erties of a trabecular bone representative volume element (RVE). In this technique, images generated by micro-CT are
used, allowing us to acquire information on trabecular bone morphology. In this homogenization technique, in order
to define the mechanical properties of the trabecular bone RVE, the fabric tensor concept and a bone tissue phenom-
enological law were used. Fabric tensors can be obtained by two different methodologies: mechanical-based or
morphologic-based. In the case of the morphologic-based methodology, the information of the interface between
the phases of the material is used to obtain the orientation distribution function (ODF). Micro-CT images provide infor-
mation about the changes of the phase of trabecular bone that is required to define the ODF data, and so define the
fabric tensor. This process is further explained in this section. First, aiming to define an RVE from a 2D micro-CT, the
images must be segmented. Thus, the obtained RVE describes the local trabecular bone microscale morphology and
the information regarding the changes of phase of the RVE is recorded. The image segmentation creates binarized
information, ones and zeros, that can identify what is bone, ones, and what is void space, zeros. These binarizations
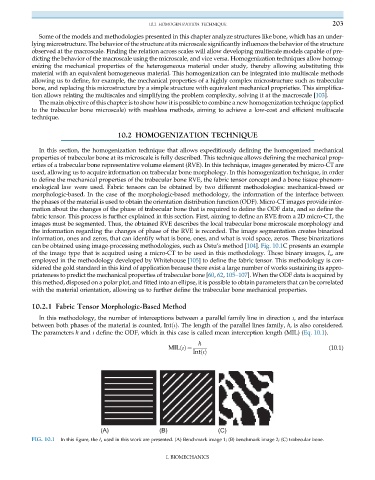
can be obtained using image-processing methodologies, such as Ostu’s method [104]. Fig. 10.1C presents an example
of the image type that is acquired using a micro-CT to be used in this methodology. These binary images, I s , are
employed in the methodology developed by Whitehouse [105] to define the fabric tensor. This methodology is con-
sidered the gold standard in this kind of application because there exist a large number of works sustaining its appro-
priateness to predict the mechanical properties of trabecular bone [60, 62, 105–107]. When the ODF data is acquired by
this method, disposed on a polar plot, and fitted into an ellipse, it is possible to obtain parameters that can be correlated
with the material orientation, allowing us to further define the trabecular bone mechanical properties.
10.2.1 Fabric Tensor Morphologic-Based Method
In this methodology, the number of interceptions between a parallel family line in direction ι, and the interface
between both phases of the material is counted, Int ιðÞ. The length of the parallel lines family, h, is also considered.
The parameters h and ι define the ODF, which in this case is called mean interception length (MIL) (Eq. 10.1).
h
(10.1)
MIL ιðÞ ¼
IntðιÞ
(A) (B) (C)
FIG. 10.1 In this figure, the I s used in this work are presented. (A) Benchmark image 1; (B) benchmark image 2; (C) trabecular bone.
I. BIOMECHANICS