
Page 213 - Advances in Biomechanics and Tissue Regeneration
P. 213
208 10. DETERMINATION OF THE ANISOTROPIC MECHANICAL PROPERTIES OF BONE TISSUE
Constitutive Matrix Values
300
200
100
0
c c c c c c c c c
11 12 13 21 22 23 31 32 33
1×1 2×2 3×3 4×4 5×5 6×6 7×7 8×8 9×9 10×10
(A)
Constitutive Matrix Values
1000
800
600
400
200
0
c c c c c c c c c
11 12 13 21 22 23 31 32 33
1×1 2×2 3×3 4×4 5×5 6×6 7×7 8×8 9×9 10×10
(B)
Constitutive Matrix Values
4000
3000
2000
1000
0
–1000
c c c c c c c c c
11 12 13 21 22 23 31 32 33
1×1 2×2 3×3 4×4 5×5 6×6 7×7 8×8 9×9 10×10
(C)
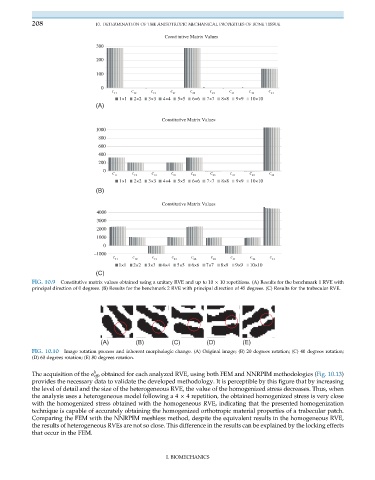
FIG. 10.9 Constitutive matrix values obtained using a unitary RVE and up to 10 10 repetitions. (A) Results for the benchmark 1 RVE with
principal direction of 0 degrees. (B) Results for the benchmark 2 RVE with principal direction of 45 degrees. (C) Results for the trabecular RVE.
(A) (B) (C) (D) (E)
FIG. 10.10 Image rotation process and inherent morphologic change. (A) Original image; (B) 20 degrees rotation; (C) 40 degrees rotation;
(D) 60 degrees rotation; (E) 80 degrees rotation.
h
The acquisition of the σ eff , obtained for each analyzed RVE, using both FEM and NNRPIM methodologies (Fig. 10.13)
provides the necessary data to validate the developed methodology. It is perceptible by this figure that by increasing
the level of detail and the size of the heterogeneous RVE, the value of the homogenized stress decreases. Thus, when
the analysis uses a heterogeneous model following a 4 4 repetition, the obtained homogenized stress is very close
with the homogenized stress obtained with the homogeneous RVE, indicating that the presented homogenization
technique is capable of accurately obtaining the homogenized orthotropic material properties of a trabecular patch.
Comparing the FEM with the NNRPIM meshless method, despite the equivalent results in the homogeneous RVE,
the results of heterogeneous RVEs are not so close. This difference in the results can be explained by the locking effects
that occur in the FEM.
I. BIOMECHANICS