
Page 235 - Advances in Biomechanics and Tissue Regeneration
P. 235
11.4 RESULTS 231
TABLE 11.4 Statistics for the Clinical Follow-Up
Study Wiss zone Cases Comminution grade Cases
A 2 7 None 29
3 11 1 9
4 22 2 9
5 15 3 1
4 7
Total 55 Total 55
B 5 9 None 9
5 5 2 5
5 1 4 1
Total 15 Total 15
U. U3
0.18
0.13
0.09
0.04
–0.00
–0.05
–0.10
–0.14
–0.19
–0.23
–0.28
–0.33
–0.37
(A) (B) (C)
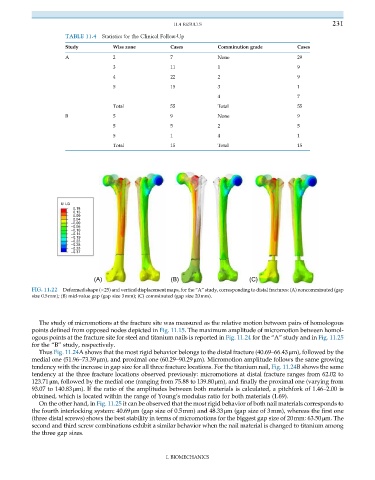
FIG. 11.22 Deformed shape ( 25) and vertical displacement maps, for the “A” study, corresponding to distal fractures: (A) noncomminuted (gap
size 0.5mm); (B) mid-value gap (gap size 3mm); (C) comminuted (gap size 20mm).
The study of micromotions at the fracture site was measured as the relative motion between pairs of homologous
points defined from opposed nodes depicted in Fig. 11.15. The maximum amplitude of micromotion between homol-
ogous points at the fracture site for steel and titanium nails is reported in Fig. 11.24 for the “A” study and in Fig. 11.25
for the “B” study, respectively.
Thus Fig. 11.24A shows that the most rigid behavior belongs to the distal fracture (40.69–66.43μm), followed by the
medial one (51.96–73.39μm), and proximal one (60.29–90.29μm). Micromotion amplitude follows the same growing
tendency with the increase in gap size for all three fracture locations. For the titanium nail, Fig. 11.24B shows the same
tendency at the three fracture locations observed previously: micromotions at distal fracture ranges from 62.02 to
123.71μm, followed by the medial one (ranging from 75.88 to 139.80μm), and finally the proximal one (varying from
93.07 to 140.83μm). If the ratio of the amplitudes between both materials is calculated, a pitchfork of 1.46–2.00 is
obtained, which is located within the range of Young’s modulus ratio for both materials (1.69).
On the other hand, in Fig. 11.25 it can be observed that the most rigid behavior of both nail materials corresponds to
the fourth interlocking system: 40.69μm (gap size of 0.5mm) and 48.33μm (gap size of 3mm), whereas the first one
(three distal screws) shows the best stability in terms of micromotions for the biggest gap size of 20mm: 63.50μm. The
second and third screw combinations exhibit a similar behavior when the nail material is changed to titanium among
the three gap sizes.
I. BIOMECHANICS