Page 235 - Advances in Forensic Applications of Mass Spectrometry - Jehuda Yinon
P. 235

1522_book.fm  Page 208  Thursday, November 13, 2003  9:58 AM


                             its use as a preservative. It was thus determined that police authorities had
                             not tampered with the evidence. In support of the specificity of MS/MS,
                                                                               10
                             scientists at Cornell University published their findings   for determining
                             EDTA in blood. They found that the use of LC/MS/MS removes the chemical
                             background or interferences from the target compound of interest; in fact,
                             in their experiments “the blank blood plasma sample is free of all matrix
                             peaks” or potential interferences. They stated that MS/MS  “provides the
                             highest specificity and the best detection level of any method currently pub-
                             lished.” Also, in their conclusions in reference to the O.J. Simpson trial, “The
                             question of blood-evidence tampering in a criminal trial has led not only to
                             improved analytical techniques for the determination of EDTA but also to
                             the demonstration that a relatively new technique (MS/MS) is ready to be
                             used as credible evidence in the courtroom.” The high specificity of MS/MS
                             has lead some scientists to consider that the results are irrefutable. 11

                             5.2.3.1  GC/MS and GC/MS/MS Spectra Comparison
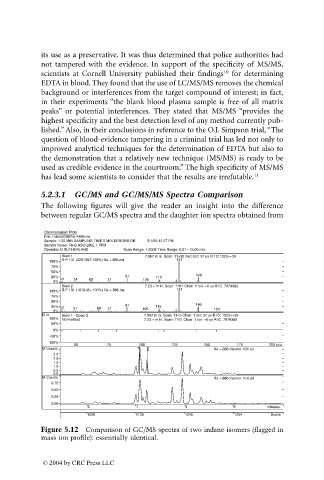
                             The following figures will give the reader an insight into the difference
                             between regular GC/MS spectra and the daughter ion spectra obtained from


                             Chromatogram Plots
                             File: I:\data0199\file 4886.ms
                             Sample: 1.00 MIN SAMPLING TIME.5 MIN DESORB.GB            5/1/99 12:27 PM
                             Sample Notes: F6-G ASO LINE 1 PPM
                             Operator: D.SUTHERLAND                                   Scan Range: 1-2008 Time Range: 0.01 - 15.00 min.
                                  Slecl 1                7.087 m In. Scan: 11+50 han: Ion: 37 us R 10: 1023++39
                                  B P 131 (3201387-100%) file + 886.ms  131
                               100%
                               75%
                               50%
                               25%                  91      115         146
                                  41  51  63   77        105
                                0%
                                  Slecl 2                7.23 + m In. Scan: 1161 Chan: 1 Ion: +6 us R IC: 7979382
                               100%  B P 131 (1816+8+-100%) file + 886.ms  131
                               75%
                               50%
                                                    91                 146
                               25% 41  51   69  77       105  115           160
                                0%
                             D In  Slecl 1 - Specl 2     7.087 m In. Scan: 11+5 Chan: 1 lon: 37 us R IC: 1023++39
                               100%  Normalized          7.23 + m In. Scan: 1161 Chan: 1 lon: +6 us R IC: 7979382
                               50%
                                0%
                               −50%
                              −100%
                                      50       75       100      125      150      175      200 m/z
                             M Counts                                       file + 886 msions: 131 all
                                2.5
                                2.0
                                1.5
                                1.0
                                0.5
                                0.0
                             M Counts                                       file + 886 msions: 1+6 all
                               0.75
                               0.50
                               0.25
                               0.00
                                          6            7             8            9        minutes
                                         1026          1135         1245          1354      Scans
                             Figure 5.12  Comparison of GC/MS spectra of two indane isomers (flagged in
                             mass ion profile): essentially identical.
                             © 2004 by CRC Press LLC
   230   231   232   233   234   235   236   237   238   239   240