
Page 238 - Advances in Forensic Applications of Mass Spectrometry - Jehuda Yinon
P. 238
1522_book.fm Page 211 Thursday, November 13, 2003 9:58 AM
Chromatoqram Plots
Plot 1: I:\data 0199\file 4886.ms Ioms: 131 all
Plot 2: I:\data 0999\f570 Ms2. ms Ioms: 131 all
Slecl 1 7.097 m In. Scan: 11+6 Chan: 1 Ion: 37 us R IC: 10170939
100% B P 131 (30+8039-100%) file + 886.ms 131
75%
50%
146
25% 51 91 115
41 63 77 105
0%
Slecl 2 7.099 m In. Scan: 3+3 Chan: 1 Ion: NA R IC: 12512
B P 131 (389+-100%) 1570+ms2 ms 131
100%
75%
119
50%
105
25% 91 147
0% 57 75 84 165 181 19+ 202
D In Slecl 1 - Specl 2 7.097 m In. Scan: 11+6 Chan: 1 lon: 37 us R IC: 10170939
100% Normalized 7.099 m In. Scan: 3+3 Chan: 1 lon: NA R IC: 12512
50%
0%
−50%
−100%
50 75 100 125 150 175 200 m/z
M Counts file + 886 msions: 131 all
2.5
2.0
1.5
1.0
0.5
0.0
K Counts f57 o+m s2.ms Ions: 131 all
3
2
1
6 7 8 9 minutes
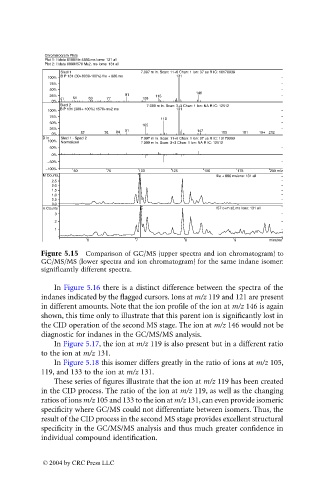
Figure 5.15 Comparison of GC/MS (upper spectra and ion chromatogram) to
GC/MS/MS (lower spectra and ion chromatogram) for the same indane isomer:
significantly different spectra.
In Figure 5.16 there is a distinct difference between the spectra of the
indanes indicated by the flagged cursors. Ions at m/z 119 and 121 are present
in different amounts. Note that the ion profile of the ion at m/z 146 is again
shown, this time only to illustrate that this parent ion is significantly lost in
the CID operation of the second MS stage. The ion at m/z 146 would not be
diagnostic for indanes in the GC/MS/MS analysis.
In Figure 5.17, the ion at m/z 119 is also present but in a different ratio
to the ion at m/z 131.
In Figure 5.18 this isomer differs greatly in the ratio of ions at m/z 105,
119, and 133 to the ion at m/z 131.
These series of figures illustrate that the ion at m/z 119 has been created
in the CID process. The ratio of the ion at m/z 119, as well as the changing
ratios of ions m/z 105 and 133 to the ion at m/z 131, can even provide isomeric
specificity where GC/MS could not differentiate between isomers. Thus, the
result of the CID process in the second MS stage provides excellent structural
specificity in the GC/MS/MS analysis and thus much greater confidence in
individual compound identification.
© 2004 by CRC Press LLC