Page 236 - Advances in Forensic Applications of Mass Spectrometry - Jehuda Yinon
P. 236

1522_book.fm  Page 209  Thursday, November 13, 2003  9:58 AM


                             Chromatogram Plots
                             File: I:\data 0199\Tlle 4886.ms
                             Sample: 1.00M IN SAMPLING TIME, 5M IN DESORB, GB                5/1/99  12.27 PM
                             Sample Notes: F6-GASOLINE 1PPM
                             Operator: D.SUTHERLAND        Scan Range: 1-2008 Time Range: 0.01-15.00 min.
                                 Specl 1                 7.097m In.scan: 1146 chan: 1 Ions: 37 us RIC: 10170939
                                 BP 131 (30+8039-100%) Tlle 4886.ms  131
                              100%
                              75%
                              50%
                                                                         146
                              25%                   91       115
                                 41  51   63   77        105
                               0%
                                 Specl 2                 7.959m In.scan: 1240 chan: 1 Ions: 34 us RIC: 11856453
                                 BP 131 (2781796-100%) Tlle 4886.ms  131
                              100%
                              75%
                              50%
                                                                        146
                              25%  41  57    71     91       115
                               0%                        105                   162
                             D Tll  Specl 1 - Specl 2    7.097m In.scan: 1146 chan: 1 Ions: 37 us RIC: 10170939
                              100%  Normalized           7.959m In.scan: 1240 chan: 1 Ions: 34 us RIC: 11856453
                              50%
                               0%
                              −50%
                             −100%
                                     50        75       100      125       150      175     m/z  200
                             MCounts                                         file+886.ms lons: 131 all
                               2.5
                               2.0
                               1.5
                               1.0
                               0.5
                               0.0
                             MCounts                                         file 4886.ms lons: 146 all
                              0.75
                              0.50
                              0.25
                              0.00
                                         6             7             8             9       minutes
                                                                3
                                         1026          1135          1245          1354      scans
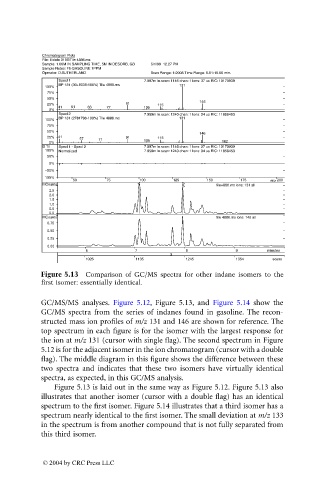
                             Figure 5.13  Comparison of GC/MS spectra for other indane isomers to the
                             first isomer: essentially identical.
                             GC/MS/MS analyses.  Figure 5.12,  Figure 5.13,  and  Figure 5.14  show the
                             GC/MS spectra from the series of  indanes found in gasoline.  The  recon-
                             structed mass ion profiles of m/z 131 and 146 are shown for reference. The
                             top spectrum in each figure is for the isomer with the largest response for
                             the ion at m/z 131 (cursor with single flag). The second spectrum in Figure
                             5.12 is for the adjacent isomer in the ion chromatogram (cursor with a double
                             flag). The middle diagram in this figure shows the difference between these
                             two spectra and indicates that these two isomers have  virtually identical
                             spectra, as expected, in this GC/MS analysis.
                                Figure 5.13 is laid out in the same way as Figure 5.12. Figure 5.13 also
                             illustrates that another isomer (cursor with a double flag) has an identical
                             spectrum to the first isomer. Figure 5.14 illustrates that a third isomer has a
                             spectrum nearly identical to the first isomer. The small deviation at m/z 133
                             in the spectrum is from another compound that is not fully separated from
                             this third isomer.


                             © 2004 by CRC Press LLC
   231   232   233   234   235   236   237   238   239   240   241