
Page 237 - Advances in Forensic Applications of Mass Spectrometry - Jehuda Yinon
P. 237
1522_book.fm Page 210 Thursday, November 13, 2003 9:58 AM
Chromatogram Plots
File: I:\data0199\file 4886.ms
Sample: 1.00 MIN SAMPLING TIME.5 MIN DESORB.GB 5/1/99 12:27 PM
Sample Notes: F6-G ASO LINE 1 PPM
Operator: D.SUTHERLAND Scan Range: 1-2008 Time Range: 0.01 - 15.00 min.
Slecl 1 7.087 m In. Scan: 11+5 Chan: 1 Ion: 37 us R IC: 1023++39
B P 131 (3201387-100%) file + 886.ms 131
100%
75%
50%
25% 41 51 63 77 91 105 115 146
0%
Slecl 2 8.12 + m In. Scan: 1258 Chan: 1 Ion: +6 us R IC: 8322250
B P 131 (13611+1-100%) file + 886.ms 131
100%
75%
50%
41 91 146
25% 57 69 105 115 162
0%
D In Slecl 1 - Specl 2 7.087 m In. Scan: 11+5 Chan: 1 lon: 37 us R IC: 1023++39
100% Normalized 8.12 + m In. Scan: 1258 Chan: 1 lon: +6 us R IC: 8322250
50%
0%
−50%
−100%
50 75 100 125 150 175 200 m/z
MCounts file + 886 msions: 131 all
2.5
2.0
1.5
1.0
0.5
0.0
MCounts file + 886 msions: 1+6 all
0.75
0.50
0.25
0.00
6 7 8 9 minutes
1026 1135 1245 1354 Scans
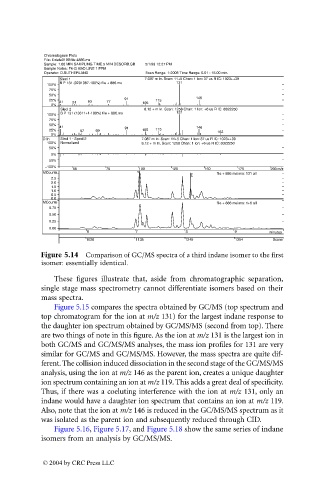
Figure 5.14 Comparison of GC/MS spectra of a third indane isomer to the first
isomer: essentially identical.
These figures illustrate that, aside from chromatographic separation,
single stage mass spectrometry cannot differentiate isomers based on their
mass spectra.
Figure 5.15 compares the spectra obtained by GC/MS (top spectrum and
top chromatogram for the ion at m/z 131) for the largest indane response to
the daughter ion spectrum obtained by GC/MS/MS (second from top). There
are two things of note in this figure. As the ion at m/z 131 is the largest ion in
both GC/MS and GC/MS/MS analyses, the mass ion profiles for 131 are very
similar for GC/MS and GC/MS/MS. However, the mass spectra are quite dif-
ferent. The collision induced dissociation in the second stage of the GC/MS/MS
analysis, using the ion at m/z 146 as the parent ion, creates a unique daughter
ion spectrum containing an ion at m/z 119. This adds a great deal of specificity.
Thus, if there was a coeluting interference with the ion at m/z 131, only an
indane would have a daughter ion spectrum that contains an ion at m/z 119.
Also, note that the ion at m/z 146 is reduced in the GC/MS/MS spectrum as it
was isolated as the parent ion and subsequently reduced through CID.
Figure 5.16, Figure 5.17, and Figure 5.18 show the same series of indane
isomers from an analysis by GC/MS/MS.
© 2004 by CRC Press LLC