
Page 116 - Advances in Renewable Energies and Power Technologies
P. 116
5. Forecast Accuracy Evaluation 89
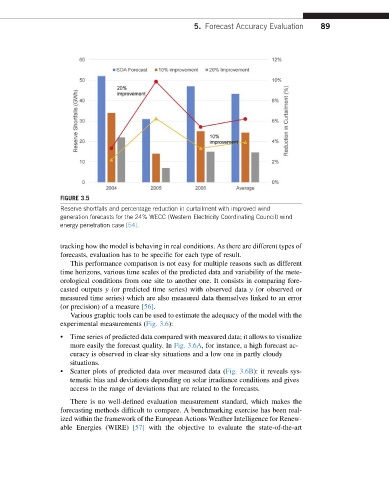
FIGURE 3.5
Reserve shortfalls and percentage reduction in curtailment with improved wind
generation forecasts for the 24% WECC (Western Electricity Coordinating Council) wind
energy penetration case [54].
tracking how the model is behaving in real conditions. As there are different types of
forecasts, evaluation has to be specific for each type of result.
This performance comparison is not easy for multiple reasons such as different
time horizons, various time scales of the predicted data and variability of the mete-
orological conditions from one site to another one. It consists in comparing fore-
casted outputs y (or predicted time series) with observed data y (or observed or
measured time series) which are also measured data themselves linked to an error
(or precision) of a measure [56].
Various graphic tools can be used to estimate the adequacy of the model with the
experimental measurements (Fig. 3.6):
• Time series of predicted data compared with measured data; it allows to visualize
more easily the forecast quality. In Fig. 3.6A, for instance, a high forecast ac-
curacy is observed in clear-sky situations and a low one in partly cloudy
situations.
• Scatter plots of predicted data over measured data (Fig. 3.6B): it reveals sys-
tematic bias and deviations depending on solar irradiance conditions and gives
access to the range of deviations that are related to the forecasts.
There is no well-defined evaluation measurement standard, which makes the
forecasting methods difficult to compare. A benchmarking exercise has been real-
ized within the framework of the European Actions Weather Intelligence for Renew-
able Energies (WIRE) [57] with the objective to evaluate the state-of-the-art