Page 117 - Advances in Renewable Energies and Power Technologies
P. 117

90     CHAPTER 3 Forecasting of Intermittent Solar Energy Resource


                            1000
                             900
                            Global horizontal irradiance (Wh/m 2 )  600
                             800
                             700

                             500
                             400
                             300
                             200
                             100                                                     Measure
                                                                                     Forecast
                              0
                                                               1400
                                   1340      1360     1380 Time (hours)  1420    1440
                           Forecasted global horizontal irradiance (Wh/m 2 ) 1000
                            900
                            800
                            700
                            600
                            500
                            400
                            300
                            200
                            100
                              0
                              0    100   200   300    400  500   600    700   800   900  1000
                                                                          2
                                              Measured global horizontal irradiance (Wh/m )
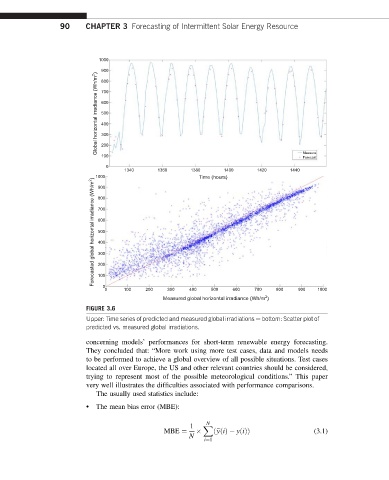
                         FIGURE 3.6
                         Upper: Time series of predicted and measured global irradiations e bottom: Scatter plot of
                         predicted vs. measured global irradiations.

                         concerning models’ performances for short-term renewable energy forecasting.
                         They concluded that: “More work using more test cases, data and models needs
                         to be performed to achieve a global overview of all possible situations. Test cases
                         located all over Europe, the US and other relevant countries should be considered,
                         trying to represent most of the possible meteorological conditions.” This paper
                         very well illustrates the difficulties associated with performance comparisons.
                            The usually used statistics include:
                         •  The mean bias error (MBE):

                                                          N
                                                      1  X
                                              MBE ¼         ðb yðiÞ  yðiÞÞ              (3.1)
                                                     N
                                                          i¼1
   112   113   114   115   116   117   118   119   120   121   122