
Page 132 - Advances in Renewable Energies and Power Technologies
P. 132
6. Forecasting Methods for Different Forecast Horizons 105
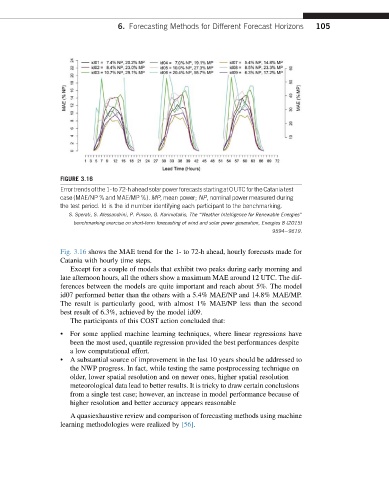
FIGURE 3.16
Error trendsofthe1-to 72-hahead solar powerforecasts startingat0 UTC for the Catania test
case (MAE/NP % and MAE/MP %). MP, mean power; NP, nominal power measured during
the test period. Id is the id number identifying each participant to the benchmarking.
S. Sperati, S. Alessandrini, P. Pinson, G. Kariniotakis, The “Weather Intelligence for Renewable Energies”
benchmarking exercise on short-term forecasting of wind and solar power generation, Energies 8 (2015)
9594e9619.
Fig. 3.16 shows the MAE trend for the 1- to 72-h ahead, hourly forecasts made for
Catania with hourly time steps.
Except for a couple of models that exhibit two peaks during early morning and
late afternoon hours, all the others show a maximum MAE around 12 UTC. The dif-
ferences between the models are quite important and reach about 5%. The model
id07 performed better than the others with a 5.4% MAE/NP and 14.8% MAE/MP.
The result is particularly good, with almost 1% MAE/NP less than the second
best result of 6.3%, achieved by the model id09.
The participants of this COST action concluded that:
• For some applied machine learning techniques, where linear regressions have
been the most used, quantile regression provided the best performances despite
a low computational effort.
• A substantial source of improvement in the last 10 years should be addressed to
the NWP progress. In fact, while testing the same postprocessing technique on
older, lower spatial resolution and on newer ones, higher spatial resolution
meteorological data lead to better results. It is tricky to draw certain conclusions
from a single test case; however, an increase in model performance because of
higher resolution and better accuracy appears reasonable
A quasiexhaustive review and comparison of forecasting methods using machine
learning methodologies were realized by [56].