
Page 182 - Advances in Renewable Energies and Power Technologies
P. 182
3. Smart Maximum Power Point Tracker Under Partial Shading Conditions 155
Radiation (W/m2)
1000
G2
500 G1
G3
0
0 2 4 6 8 10 12
200 Power (W)
Pmax Pmp
100
P-FLC P-PSO
0
0 2 4 6 8 10 12
Duty Ratio
D-PSO
0.5 D-FLC
0
0 2 4 6 8 10 12
PV Terminal Voltage (V)
50
V-FLC
V-PSO
0
0 2 4 6 8 10 12
% Increase in PV power from PSO and FLC
4
3.5
3
0 2 4 6 8 10 12
Time (Sec.)
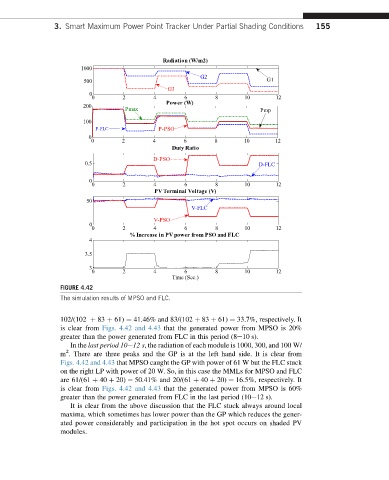
FIGURE 4.42
The simulation results of MPSO and FLC.
102/(102 þ 83 þ 61) ¼ 41.46% and 83/(102 þ 83 þ 61) ¼ 33.7%, respectively. It
is clear from Figs. 4.42 and 4.43 that the generated power from MPSO is 20%
greater than the power generated from FLC in this period (8e10 s).
In the last period 10e12 s, the radiation of each module is 1000, 300, and 100 W/
2
m . There are three peaks and the GP is at the left hand side. It is clear from
Figs. 4.42 and 4.43 that MPSO caught the GP with power of 61 W but the FLC stuck
on the right LP with power of 20 W. So, in this case the MMLs for MPSO and FLC
are 61/(61 þ 40 þ 20) ¼ 50.41% and 20/(61 þ 40 þ 20) ¼ 16.5%, respectively. It
is clear from Figs. 4.42 and 4.43 that the generated power from MPSO is 60%
greater than the power generated from FLC in the last period (10e12 s).
It is clear from the above discussion that the FLC stuck always around local
maxima, which sometimes has lower power than the GP which reduces the gener-
ated power considerably and participation in the hot spot occurs on shaded PV
modules.