
Page 180 - Advances in Renewable Energies and Power Technologies
P. 180
3. Smart Maximum Power Point Tracker Under Partial Shading Conditions 153
L1 D3
G3 1e–3 0.17
V
S +
I
47e–5
V G1 + 54
G2 To –
V
V
I –
+
–
+ Pmax
+ Σ
S + V
+
I –
+ 25
–
S +
I –
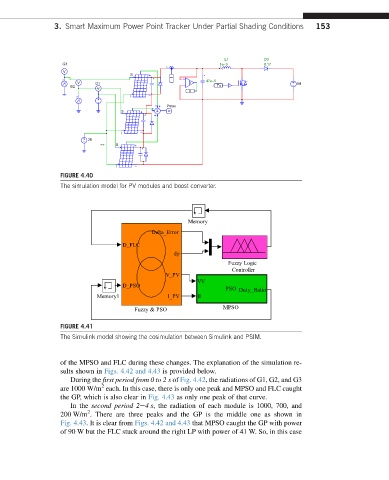
FIGURE 4.40
The simulation model for PV modules and boost converter.
Memory
Delta_Error
D_FLC
dp
Fuzzy Logic
Controller
V_PV
VV
D_PSO
PSO Duty_Ratio
Memory1 I_PV II
Fuzzy & PSO MPSO
FIGURE 4.41
The Simulink model showing the cosimulation between Simulink and PSIM.
of the MPSO and FLC during these changes. The explanation of the simulation re-
sults shown in Figs. 4.42 and 4.43 is provided below.
During the first period from 0 to 2 s of Fig. 4.42, the radiations of G1, G2, and G3
2
are 1000 W/m each. In this case, there is only one peak and MPSO and FLC caught
the GP, which is also clear in Fig. 4.43 as only one peak of that curve.
In the second period 2e4s, the radiation of each module is 1000, 700, and
2
200 W/m . There are three peaks and the GP is the middle one as shown in
Fig. 4.43. It is clear from Figs. 4.42 and 4.43 that MPSO caught the GP with power
of 90 W but the FLC stuck around the right LP with power of 41 W. So, in this case