
Page 175 - Advances in Renewable Energies and Power Technologies
P. 175
148 CHAPTER 4 Performance of MPPT Techniques of Photovoltaic Systems
70
Total Power (W)
60
50
Power (W) 40 1000 W/m2
30
20
10
500 W/m2
0
0 10 20 30 40
PV Voltage (V)
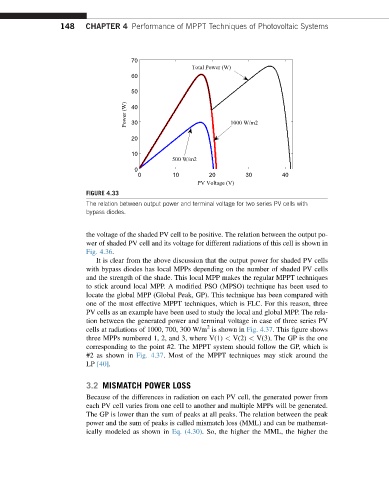
FIGURE 4.33
The relation between output power and terminal voltage for two series PV cells with
bypass diodes.
the voltage of the shaded PV cell to be positive. The relation between the output po-
wer of shaded PV cell and its voltage for different radiations of this cell is shown in
Fig. 4.36.
It is clear from the above discussion that the output power for shaded PV cells
with bypass diodes has local MPPs depending on the number of shaded PV cells
and the strength of the shade. This local MPP makes the regular MPPT techniques
to stick around local MPP. A modified PSO (MPSO) technique has been used to
locate the global MPP (Global Peak, GP). This technique has been compared with
one of the most effective MPPT techniques, which is FLC. For this reason, three
PV cells as an example have been used to study the local and global MPP. The rela-
tion between the generated power and terminal voltage in case of three series PV
2
cells at radiations of 1000, 700, 300 W/m is shown in Fig. 4.37. This figure shows
three MPPs numbered 1, 2, and 3, where V(1) < V(2) < V(3). The GP is the one
corresponding to the point #2. The MPPT system should follow the GP, which is
#2 as shown in Fig. 4.37. Most of the MPPT techniques may stick around the
LP [40].
3.2 MISMATCH POWER LOSS
Because of the differences in radiation on each PV cell, the generated power from
each PV cell varies from one cell to another and multiple MPPs will be generated.
The GP is lower than the sum of peaks at all peaks. The relation between the peak
power and the sum of peaks is called mismatch loss (MML) and can be mathemat-
ically modeled as shown in Eq. (4.30). So, the higher the MML, the higher the