
Page 179 - Advances in Renewable Energies and Power Technologies
P. 179
152 CHAPTER 4 Performance of MPPT Techniques of Photovoltaic Systems
PSIM and Simulink software packages is used. The co-simulation is done to take
advantage of each program to handle certain parts of the system. The response of
the different MPPT techniques is evaluated in rapidly changing weather conditions.
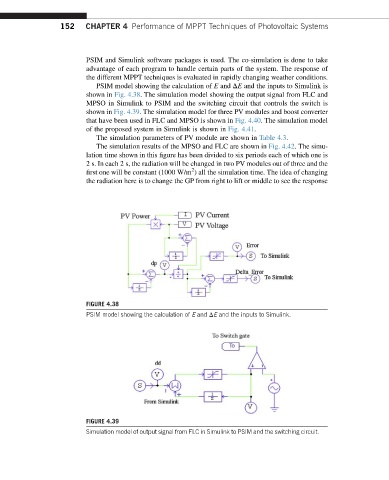
PSIM model showing the calculation of E and DE and the inputs to Simulink is
shown in Fig. 4.38. The simulation model showing the output signal from FLC and
MPSO in Simulink to PSIM and the switching circuit that controls the switch is
shown in Fig. 4.39. The simulation model for three PV modules and boost converter
that have been used in FLC and MPSO is shown in Fig. 4.40. The simulation model
of the proposed system in Simulink is shown in Fig. 4.41.
The simulation parameters of PV module are shown in Table 4.3.
The simulation results of the MPSO and FLC are shown in Fig. 4.42. The simu-
lation time shown in this figure has been divided to six periods each of which one is
2 s. In each 2 s, the radiation will be changed in two PV modules out of three and the
2
first one will be constant (1000 W/m ) all the simulation time. The idea of changing
the radiation here is to change the GP from right to lift or middle to see the response
FIGURE 4.38
PSIM model showing the calculation of E and DE and the inputs to Simulink.
FIGURE 4.39
Simulation model of output signal from FLC in Simulink to PSIM and the switching circuit.