
Page 181 - Advances in Renewable Energies and Power Technologies
P. 181
154 CHAPTER 4 Performance of MPPT Techniques of Photovoltaic Systems
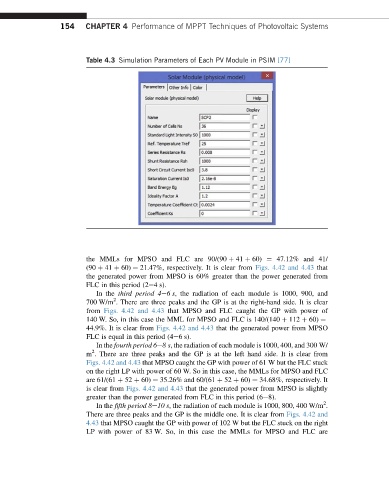
Table 4.3 Simulation Parameters of Each PV Module in PSIM [77]
the MMLs for MPSO and FLC are 90/(90 þ 41 þ 60) ¼ 47.12% and 41/
(90 þ 41 þ 60) ¼ 21.47%, respectively. It is clear from Figs. 4.42 and 4.43 that
the generated power from MPSO is 60% greater than the power generated from
FLC in this period (2e4 s).
In the third period 4e6s, the radiation of each module is 1000, 900, and
2
700 W/m . There are three peaks and the GP is at the right-hand side. It is clear
from Figs. 4.42 and 4.43 that MPSO and FLC caught the GP with power of
140 W. So, in this case the MML for MPSO and FLC is 140/(140 þ 112 þ 60) ¼
44.9%. It is clear from Figs. 4.42 and 4.43 that the generated power from MPSO
FLC is equal in this period (4e6 s).
In the fourth period 6e8s, the radiation of each module is 1000, 400, and 300 W/
2
m . There are three peaks and the GP is at the left hand side. It is clear from
Figs. 4.42 and 4.43 that MPSO caught the GP with power of 61 W but the FLC stuck
on the right LP with power of 60 W. So in this case, the MMLs for MPSO and FLC
are 61/(61 þ 52 þ 60) ¼ 35.26% and 60/(61 þ 52 þ 60) ¼ 34.68%, respectively. It
is clear from Figs. 4.42 and 4.43 that the generated power from MPSO is slightly
greater than the power generated from FLC in this period (6e8).
2
In the fifth period 8e10 s, the radiation of each module is 1000, 800, 400 W/m .
There are three peaks and the GP is the middle one. It is clear from Figs. 4.42 and
4.43 that MPSO caught the GP with power of 102 W but the FLC stuck on the right
LP with power of 83 W. So, in this case the MMLs for MPSO and FLC are