
Page 172 - Advances in Renewable Energies and Power Technologies
P. 172
3. Smart Maximum Power Point Tracker Under Partial Shading Conditions 145
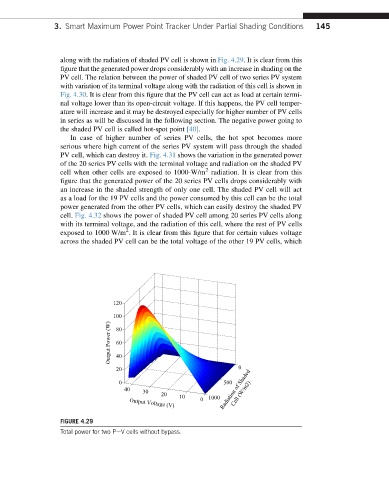
along with the radiation of shaded PV cell is shown in Fig. 4.29. It is clear from this
figure that the generated power drops considerably with an increase in shading on the
PV cell. The relation between the power of shaded PV cell of two series PV system
with variation of its terminal voltage along with the radiation of this cell is shown in
Fig. 4.30. It is clear from this figure that the PV cell can act as load at certain termi-
nal voltage lower than its open-circuit voltage. If this happens, the PV cell temper-
ature will increase and it may be destroyed especially for higher number of PV cells
in series as will be discussed in the following section. The negative power going to
the shaded PV cell is called hot-spot point [40].
In case of higher number of series PV cells, the hot spot becomes more
serious where high current of the series PV system will pass through the shaded
PV cell, which can destroy it. Fig. 4.31 shows the variation in the generated power
of the 20 series PV cells with the terminal voltage and radiation on the shaded PV
2
cell when other cells are exposed to 1000-W/m radiation. It is clear from this
figure that the generated power of the 20 series PV cells drops considerably with
an increase in the shaded strength of only one cell. The shaded PV cell will act
as a load for the 19 PV cells and the power consumed by this cell can be the total
power generated from the other PV cells, which can easily destroy the shaded PV
cell. Fig. 4.32 shows the power of shaded PV cell among 20 series PV cells along
with its terminal voltage, and the radiation of this cell, where the rest of PV cells
2
exposedto1000 W/m . It is clear from this figure that for certain values voltage
across the shaded PV cell can be the total voltage of the other 19 PV cells, which
120
100
Output Power (W) 80
60
40
20 0
0 500
40 30 Radiation of Shaded
20 10 Cell (W/m2)
0 1000
Output Voltage (V)
FIGURE 4.29
Total power for two PeV cells without bypass.