
Page 199 - Advances in Renewable Energies and Power Technologies
P. 199
172 CHAPTER 5 DMPPT PV System: Modeling and Control Techniques
technique works as follows: when the output voltage v outk of the k-th LSCPVU ex-
ceeds a guard level V out lim (V out lim < V ds max ) thus becoming closer to V ds max , the
MPPT function carries out an inversion of direction of tracking (direction of
decreasing of output power P pank ). Summarizing, when v outk V out lim , then the
MP&O MPPT technique drives the k-th LSCPVU in the direction of increasing
output power; instead, when v outk > V out lim , it drives the k-th LSCPVU in the direc-
tion of decreasing output power. It is appropriate to adopt a value of V out lim , which is
as high as possible to profitably exploit the whole voltage rating V ds max of
LSCPVUs’ components. In fact, the adoption of the guard-level voltage V out lim is
obviously equivalent, in practice, to the choice of LSCPVUs’ power components
characterized by a voltage rating equal to V out lim instead that equal to V ds max ,
with V out lim < V ds max . As a rule of thumb, the higher V out lim , the higher the
maximum power which can be extracted from the PV systems adopting micro-
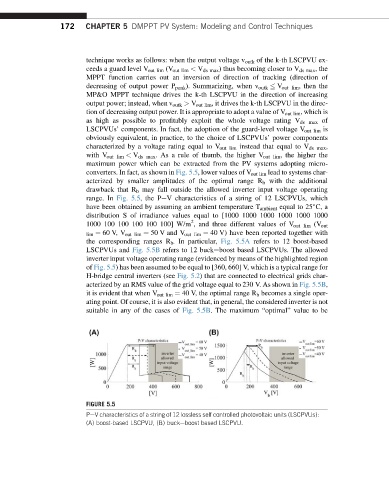
converters. In fact, as shown in Fig. 5.5, lower values of V out lim lead to systems char-
acterized by smaller amplitudes of the optimal range R b with the additional
drawback that R b may fall outside the allowed inverter input voltage operating
range. In Fig. 5.5, the PeV characteristics of a string of 12 LSCPVUs, which
have been obtained by assuming an ambient temperature T ambient equal to 25 C, a
distribution S of irradiance values equal to [1000 1000 1000 1000 1000 1000
2
1000 100 100 100 100 100] W/m , and three different values of V out lim (V out
lim ¼ 60 V, V out lim ¼ 50 V and V out lim ¼ 40 V) have been reported together with
the corresponding ranges R b . In particular, Fig. 5.5A refers to 12 boost-based
LSCPVUs and Fig. 5.5B refers to 12 buckeboost based LSCPVUs. The allowed
inverter input voltage operating range (evidenced by means of the highlighted region
of Fig. 5.5) has been assumed to be equal to [360, 660] V, which is a typical range for
H-bridge central inverters (see Fig. 5.2) that are connected to electrical grids char-
acterized by an RMS value of the grid voltage equal to 230 V. As shown in Fig. 5.5B,
it is evident that when V out lim ¼ 40 V, the optimal range R b becomes a single oper-
ating point. Of course, it is also evident that, in general, the considered inverter is not
suitable in any of the cases of Fig. 5.5B. The maximum “optimal” value to be
FIGURE 5.5
PeV characteristics of a string of 12 lossless self controlled photovoltaic units (LSCPVUs):
(A) boost-based LSCPVU, (B) buckeboost based LSCPVU.