
Page 317 - Advances in Renewable Energies and Power Technologies
P. 317
290 CHAPTER 8 Hybrid PV/Batteries Bank/Diesel Generator
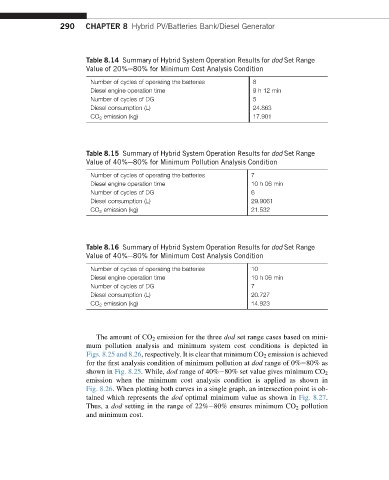
Table 8.14 Summary of Hybrid System Operation Results for dod Set Range
Value of 20%e80% for Minimum Cost Analysis Condition
Number of cycles of operating the batteries 8
Diesel engine operation time 9 h 12 min
Number of cycles of DG 5
Diesel consumption (L) 24.863
CO 2 emission (kg) 17.901
Table 8.15 Summary of Hybrid System Operation Results for dod Set Range
Value of 40%e80% for Minimum Pollution Analysis Condition
Number of cycles of operating the batteries 7
Diesel engine operation time 10 h 06 min
Number of cycles of DG 6
Diesel consumption (L) 29.9061
CO 2 emission (kg) 21.532
Table 8.16 Summary of Hybrid System Operation Results for dod Set Range
Value of 40%e80% for Minimum Cost Analysis Condition
Number of cycles of operating the batteries 10
Diesel engine operation time 10 h 06 min
Number of cycles of DG 7
Diesel consumption (L) 20.727
CO 2 emission (kg) 14.923
The amount of CO 2 emission for the three dod set range cases based on mini-
mum pollution analysis and minimum system cost conditions is depicted in
Figs. 8.25 and 8.26, respectively. It is clear that minimum CO 2 emission is achieved
for the first analysis condition of minimum pollution at dod range of 0%e80% as
shown in Fig. 8.25. While, dod range of 40%e80% set value gives minimum CO 2
emission when the minimum cost analysis condition is applied as shown in
Fig. 8.26. When plotting both curves in a single graph, an intersection point is ob-
tained which represents the dod optimal minimum value as shown in Fig. 8.27.
Thus, a dod setting in the range of 22%e80% ensures minimum CO 2 pollution
and minimum cost.