
Page 46 - Aerodynamics for Engineering Students
P. 46
Basic concepts and definitions 29
such a body is thus seen to be variable from case to case, and therefore needs to be
stated for each case.
The impression is sometimes formed that lift and drag coefficients cannot exceed
unity. This is not true; with modern developments some wings can produce lift
coefficients based on their plan-area of 10 or more.
Aerodynamic moments also can be expressed in the form of non-dimensional
coefficients. Since a moment is the product of a force and a length it follows that a
non-dimensional form for a moment is Q/pV2Sl, where Q is any aerodynamic
moment and 1 is a reference length. Here again it is conventional to replace pV2 by
$ pV2. In the case of the pitching moment of a wing the area is the plan-area S and the
length is the wing chord C or .?A (see Section 1.3.1). Then the pitching moment
coefficient C,W is defined by
(1.45)
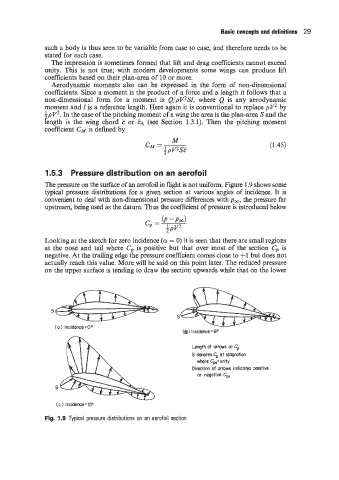
1.5.3 Pressure distribution on an aerofoil
The pressure on the surface of an aerofoil in flight is not uniform. Figure 1.9 shows some
typical pressure distributions for a given section at various angles of incidence. It is
convenient to deal with non-dimensional pressure differences with pm, the pressure far
upstream, being used as the datum. Thus the coeficient of pressure is introduced below
(P -Pd
c, =
$pv’
Looking at the sketch for zero incidence (CY = 0) it is seen that there are small regions
at the nose and tail where C, is positive but that over most of the section C, is
negative. At the trailing edge the pressure coefficient comes close to +1 but does not
actually reach this value. More will be said on this point later. The reduced pressure
on the upper surface is tending to draw the section upwards while that on the lower
S
S
i I inciaence = o-
Length of arrows cc Cp
S denotes 5 at stagnation
where Cp,=unity
Direction of arrows indicates positive
or negative Cp,
(c 1 Incidence = 15O
Fig. 1.9 Typical pressure distributions on an aerofoil section