
Page 270 - Air and gas Drilling Field Guide 3rd Edition
P. 270
10.6 Conclusions 261
Cuttings Time to Surface (min)
10 15 20 25 30
−7000
−2200
−7500
Time
−2400
−8000
Depth (ft) −8500 −2600 Depth (m)
−9000
−2800
Foam Quality
−9500
−3000
−10000
0.8 0.81 0.82 0.83 0.84 0.85 0.86
Bottom Hole Foam Quality
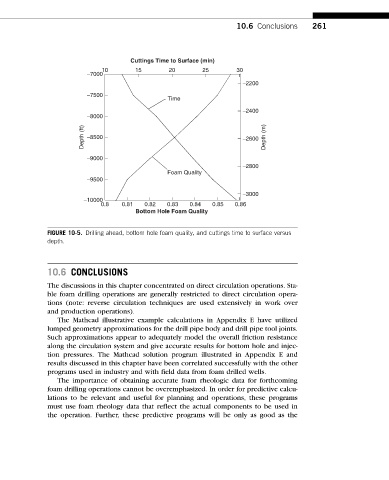
FIGURE 10-5. Drilling ahead, bottom hole foam quality, and cuttings time to surface versus
depth.
10.6 CONCLUSIONS
The discussions in this chapter concentrated on direct circulation operations. Sta-
ble foam drilling operations are generally restricted to direct circulation opera-
tions (note: reverse circulation techniques are used extensively in work over
and production operations).
The Mathcad illustrative example calculations in Appendix E have utilized
lumped geometry approximations for the drill pipe body and drill pipe tool joints.
Such approximations appear to adequately model the overall friction resistance
along the circulation system and give accurate results for bottom hole and injec-
tion pressures. The Mathcad solution program illustrated in Appendix E and
results discussed in this chapter have been correlated successfully with the other
programs used in industry and with field data from foam drilled wells.
The importance of obtaining accurate foam rheologic data for forthcoming
foam drilling operations cannot be overemphasized. In order for predictive calcu-
lations to be relevant and useful for planning and operations, these programs
must use foam rheology data that reflect the actual components to be used in
the operation. Further, these predictive programs will be only as good as the