
Page 269 - Air and gas Drilling Field Guide 3rd Edition
P. 269
260 CHAPTER 10 Stable Foam Drilling
Pressure (Psia)
400 600 800 1000 1200 1400
−7000
−2200
−7500 Bottom Hole Pressure −2400
Open Hole Depth Position (ft) −8500 −2600 Open Hole Depth Position (m)
−8000
−9000
−2800
Injection Pressure
−9500
−3000
−10000
320 400 480 560 640 720 800 880 960
Pressure (N/cm2 abs)
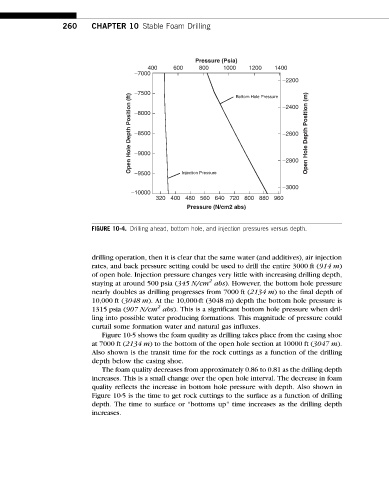
FIGURE 10-4. Drilling ahead, bottom hole, and injection pressures versus depth.
drilling operation, then it is clear that the same water (and additives), air injection
rates, and back pressure setting could be used to drill the entire 3000 ft (914 m)
of open hole. Injection pressure changes very little with increasing drilling depth,
2
staying at around 500 psia (345 N/cm abs). However, the bottom hole pressure
nearly doubles as drilling progresses from 7000 ft (2134 m) to the final depth of
10,000 ft (3048 m). At the 10,000-ft (3048 m) depth the bottom hole pressure is
2
1315 psia (907 N/cm abs). This is a significant bottom hole pressure when dril-
ling into possible water producing formations. This magnitude of pressure could
curtail some formation water and natural gas influxes.
Figure 10-5 shows the foam quality as drilling takes place from the casing shoe
at 7000 ft (2134 m) to the bottom of the open hole section at 10000 ft (3047 m).
Also shown is the transit time for the rock cuttings as a function of the drilling
depth below the casing shoe.
The foam quality decreases from approximately 0.86 to 0.81 as the drilling depth
increases. This is a small change over the open hole interval. The decrease in foam
quality reflects the increase in bottom hole pressure with depth. Also shown in
Figure 10-5 is the time to get rock cuttings to the surface as a function of drilling
depth. The time to surface or “bottoms up” time increases as the drilling depth
increases.