
Page 451 - Aircraft Stuctures for Engineering Student
P. 451
432 Stress analysis of aircraft components
and (10.63) (Ref. 1). The resulting equations are complex and require numerical
methods of solution.
Generally, composite structures consist of several laminas with the direction of the
filaments arranged so that they lie in the directions of the major loads. Thus, for a
loading system which comprises two mutually perpendicular loads, it is necessary
to build or lay-up a laminate with sufficient plies in both directions to withstand
each load. Such an arrangement is known as a cross-ply laminate. The analysis of
multi-ply laminates is complex and is normally carried out using finite difference or
finite element methods.
1 Calcote, L. R., The Analysis of Laminated Composite Structures, Van Nostrand Reinhold
Co., New York, 1969.
Datoo, M. H., Mechanics of Fibrous Composites, Elsevier Applied Science, London, 1991.
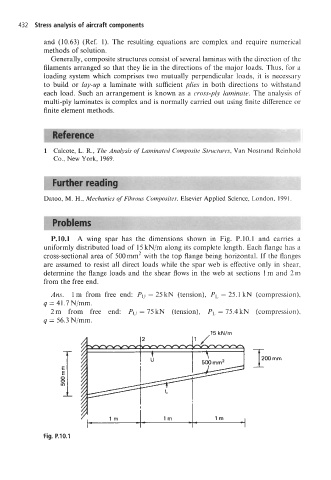
P.10.1 A wing spar has the dimensions shown in Fig. P.10.1 and carries a
uniformly distributed load of 15 kN/m along its complete length. Each flange has a
cross-sectional area of 500mm2 with the top flange being horizontal. If the flanges
are assumed to resist all direct loads while the spar web is effective only in shear,
determine the flange loads and the shear flows in the web at sections 1 m and 2m
from the free end.
Am. 1 m from free end: Pu = 25 kN (tension), PL = 25.1 kN (compression),
q = 41.7 N/mm.
2 m from free end: Pu = 75 kN (tension), PL = 75.4 kN (compression),
q = 56.3 N/mm.
lrn
c -1
Fig. P.10.1