
Page 321 -
P. 321
Chapter 8 ■ Classification 295
system for visual objects. The system learns — that is, establishes ranges for
the features that were selected for use — by being given a known object and
then identifying some pattern among the feature values. This works better if
a large number of objects and images are used in the training process, and
that means having a large set of classified objects on hand before the system is
even completed. This is called training data. It may turn out that some of the
selected features are not useful and will need to be discarded or replaced, and
this will require modifications to the system.
So, for each object in each test image, all the proposed features are measured
and stored. A classifier is built that uses these features to determine the class
of the objects as well as can be done. Rarely will this be perfect, but it could
be perfect for the training data. Finding out the actual rate of successful
classification must be done using a different set of data, not the training data,
because the system has been tuned specifically to recognize the training data
set. We must know the actual classifications for the test data, too, since we
need to determine how often the system returns the correct class. If we have
100 objects that are of known classes, then this set of data needs to be split
into two sets: one for training, one for testing. For the time being, they should
be split into two equal parts, but alternatives will be described starting in the
next section and in the remainder of the chapter.
8.1.3 Variation: In-Class and Out-Class
Part of the problem with visual classification is that objects do not look the
same in different images, in different orientations, and when seen through
different cameras. Examining the data for the carrot problem, it is easy to see
that tomatoes have a variety of different values for each of the features we have
measured so far: color (red, green, blue) and area. Indeed, no two tomatoes
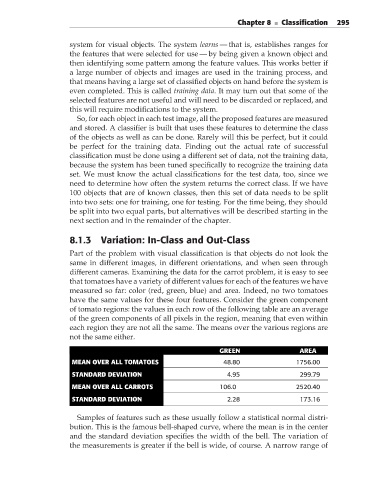
have the same values for these four features. Consider the green component
of tomato regions: the values in each row of the following table are an average
of the green components of all pixels in the region, meaning that even within
each region they are not all the same. The means over the various regions are
not the same either.
GREEN AREA
MEAN OVER ALL TOMATOES 48.80 1756.00
STANDARD DEVIATION 4.95 299.79
MEAN OVER ALL CARROTS 106.0 2520.40
STANDARD DEVIATION 2.28 173.16
Samples of features such as these usually follow a statistical normal distri-
bution. This is the famous bell-shaped curve, where the mean is in the center
and the standard deviation specifies the width of the bell. The variation of
the measurements is greater if the bell is wide, of course. A narrow range of