
Page 122 -
P. 122
102 CHAPTER 3 LINEAR PROGRAMMING: SENSITIVITY ANALYSIS AND INTERPRETATION OF SOLUTION
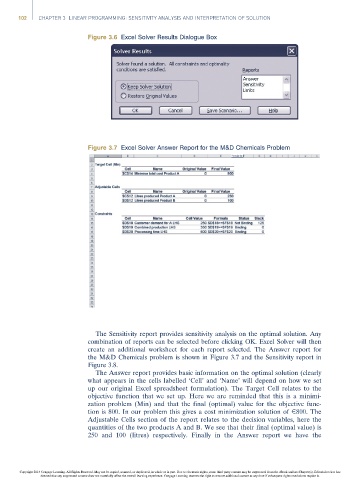
Figure 3.6 Excel Solver Results Dialogue Box
Figure 3.7 Excel Solver Answer Report for the M&D Chemicals Problem
The Sensitivity report provides sensitivity analysis on the optimal solution. Any
combination of reports can be selected before clicking OK. Excel Solver will then
create an additional worksheet for each report selected. The Answer report for
the M&D Chemicals problem is shown in Figure 3.7 and the Sensitivity report in
Figure 3.8.
The Answer report provides basic information on the optimal solution (clearly
what appears in the cells labelled ‘Cell’ and ‘Name’ will depend on how we set
up our original Excel spreadsheet formulation). The Target Cell relates to the
objective function that we set up. Here we are reminded that this is a minimi-
zation problem (Min) and that the final (optimal) value for the objective func-
tion is 800. In our problem this gives a cost minimization solution of E800. The
Adjustable Cells section of the report relates to the decision variables, here the
quantities of the two products A and B. We see that their final (optimal value) is
250 and 100 (litres) respectively. Finally in the Answer report we have the
Copyright 2014 Cengage Learning. All Rights Reserved. May not be copied, scanned, or duplicated, in whole or in part. Due to electronic rights, some third party content may be suppressed from the eBook and/or eChapter(s). Editorial review has
deemed that any suppressed content does not materially affect the overall learning experience. Cengage Learning reserves the right to remove additional content at any time if subsequent rights restrictions require it.