Page 311 -
P. 311

TRANSPORTATION SIMPLEX METHOD: A SPECIAL-PURPOSE SOLUTION PROCEDURE  291


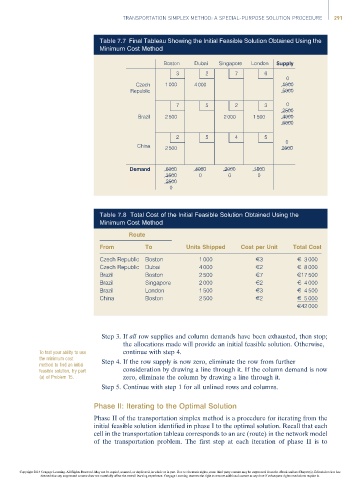
                                        Table 7.7 Final Tableau Showing the Initial Feasible Solution Obtained Using the
                                        Minimum Cost Method

                                                            Boston   Dubai   Singapore  London  Supply
                                                                3        2        7        6
                                                                                                 0
                                                   Czech    1 000    4 000                      1000
                                                  Republic                                      5000

                                                                7        5        2        3     0
                                                                                                2500
                                                    Brazil  2 500             2 000    1 500    4000
                                                                                                6000

                                                                2        5        4        5
                                                                                                 0
                                                    China   2 500                               2500


                                                 Demand     6000     4000     2000     1500
                                                            3500       0        0        0
                                                            2500
                                                              0


                                        Table 7.8 Total Cost of the Initial Feasible Solution Obtained Using the
                                        Minimum Cost Method
                                                 Route
                                        From          To           Units Shipped    Cost per Unit   Total Cost

                                        Czech Republic  Boston         1 000            E3           E 3 000
                                        Czech Republic  Dubai          4 000            E2           E 8 000
                                        Brazil        Boston           2 500            E7           E17 500
                                        Brazil        Singapore        2 000            E2           E 4 000
                                        Brazil        London           1 500            E3           E 4 500
                                        China         Boston           2 500            E2           E 5 000
                                                                                                     E42 000


                                         Step 3. If all row supplies and column demands have been exhausted, then stop;
                                               the allocations made will provide an initial feasible solution. Otherwise,
                      To test your ability to use  continue with step 4.
                      the minimum cost
                      method to find an initial  Step 4. If the row supply is now zero, eliminate the row from further
                      feasible solution, try part  consideration by drawing a line through it. If the column demand is now
                      (a) of Problem 15.       zero, eliminate the column by drawing a line through it.
                                         Step 5. Continue with step 1 for all unlined rows and columns.


                                      Phase II: Iterating to the Optimal Solution
                                      Phase II of the transportation simplex method is a procedure for iterating from the
                                      initial feasible solution identified in phase I to the optimal solution. Recall that each
                                      cell in the transportation tableau corresponds to an arc (route) in the network model
                                      of the transportation problem. The first step at each iteration of phase II is to


                Copyright 2014 Cengage Learning. All Rights Reserved. May not be copied, scanned, or duplicated, in whole or in part. Due to electronic rights, some third party content may be suppressed from the eBook and/or eChapter(s). Editorial review has
                      deemed that any suppressed content does not materially affect the overall learning experience. Cengage Learning reserves the right to remove additional content at any time if subsequent rights restrictions require it.
   306   307   308   309   310   311   312   313   314   315   316