
Page 338 -
P. 338
318 CHAPTER 7 TRANSPORTATION, ASSIGNMENT AND TRANSSHIPMENT PROBLEMS
Table 7.32 Optimal Solution to the NHS Transshipment Problem
Route
From To Units Shipped Cost per Unit, £ Total Cost, £
Geneva London 550 2 1 100
Geneva Glasgow 50 3 150
Stockholm Glasgow 400 1 400
London Edinburgh 200 2 400
London Southampton 350 3 1 050
Glasgow Manchester 150 4 600
Glasgow Newcastle 300 5 1 500
£5 200
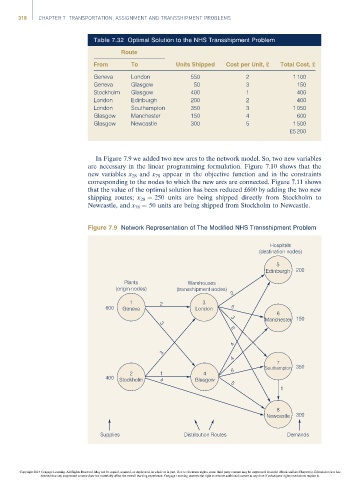
In Figure 7.9 we added two new arcs to the network model. So, two new variables
are necessary in the linear programming formulation. Figure 7.10 shows that the
new variables x 28 and x 78 appear in the objective function and in the constraints
corresponding to the nodes to which the new arcs are connected. Figure 7.11 shows
that the value of the optimal solution has been reduced £600 by adding the two new
shipping routes; x 28 ¼ 250 units are being shipped directly from Stockholm to
Newcastle, and x 78 ¼ 50 units are being shipped from Stockholm to Newcastle.
Figure 7.9 Network Representation of The Modified NHS Transshipment Problem
Hospitals
(destination nodes)
5
Edinburgh 200
Plants Warehouses
(origin nodes) (transshipment nodes)
2
1 2 3
600 Geneva London 6
6
Manchester 150
3
3 6
4
3
4
7
6 Southampton 350
2 1 4
400 Stockholm 4 Glasgow
5
1
8
Newcastle 300
Supplies Distribution Routes Demands
Copyright 2014 Cengage Learning. All Rights Reserved. May not be copied, scanned, or duplicated, in whole or in part. Due to electronic rights, some third party content may be suppressed from the eBook and/or eChapter(s). Editorial review has
deemed that any suppressed content does not materially affect the overall learning experience. Cengage Learning reserves the right to remove additional content at any time if subsequent rights restrictions require it.