
Page 444 -
P. 444
424 CHAPTER 10 INVENTORY MODELS
S ¼ Q C h (10:27)
C h þ C b
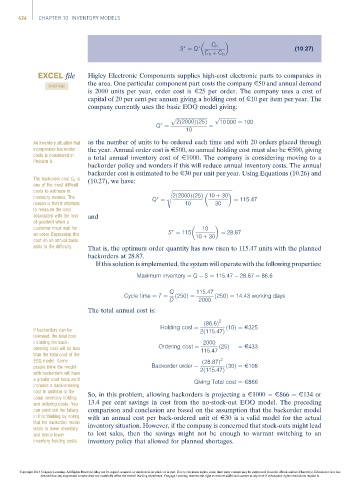
EXCEL file Higley Electronic Components supplies high-cost electronic parts to companies in
the area. One particular component part costs the company E50 and annual demand
SHORTAGE
is 2000 units per year, order cost is E25 per order. The company uses a cost of
capital of 20 per cent per annum giving a holding cost of E10 per item per year. The
company currently uses the basic EOQ model giving:
p ffiffiffiffiffiffiffiffiffiffiffiffiffiffiffiffiffiffiffiffiffiffiffiffiffiffi p ffiffiffiffiffiffiffiffiffiffiffiffiffiffi
2ð2000Þð25Þ 10 000 ¼ 100
Q ¼ ¼
10
An inventory situation that as the number of units to be ordered each time and with 20 orders placed through
incorporates backorder the year. Annual order cost is E500, so annual holding cost must also be E500, giving
costs is considered in a total annual inventory cost of E1000. The company is considering moving to a
Problem 9.
backorder policy and wonders if this will reduce annual inventory costs. The annual
backorder cost is estimated to be E30 per unit per year. Using Equations (10.26) and
The backorder cost C b is (10.27), we have:
one of the most difficult
costs to estimate in s ffiffiffiffiffiffiffiffiffiffiffiffiffiffiffiffiffiffiffiffiffiffiffiffiffiffiffiffiffiffiffiffiffiffiffiffiffiffiffiffiffiffiffiffiffiffiffiffiffiffi
inventory models. The Q ¼ 2ð2000Þð25Þ 10 þ 30 ¼ 115:47
reason is that it attempts 10 30
to measure the cost
associated with the loss and
of goodwill when a
customer must wait for 10
an order. Expressing this S ¼ 115 10 þ 30 ¼ 28:87
cost on an annual basis
adds to the difficulty. That is, the optimum order quantity has now risen to 115.47 units with the planned
backorders at 28.87.
If this solution is implemented, the system will operate with the following properties:
Maximum inventory ¼ Q S ¼ 115:47 28:87 ¼ 86:6
Q 115:47
Cycle time ¼ T ¼ ð250Þ¼ ð250Þ¼ 14:43 working days
D 2000
The total annual cost is:
ð86:6Þ 2
Holding cost ¼ ð10Þ¼ E325
If backorders can be 2ð115:47Þ
tolerated, the total cost
including the back- 2000
ordering cost will be less Ordering cost ¼ 115:47 ð25Þ ¼ E433
than the total cost of the
EOQ model. Some ð28:87Þ 2
people think the model Backorder order ¼ 2ð115:47Þ ð30Þ¼ E108
with backorders will have
a greater cost because it Giving Total cost ¼ E866
includes a back-ordering
cost in addition to the So, in this problem, allowing backorders is projecting a E1000 E866 ¼ E134 or
usual inventory holding
and ordering costs. You 13.4 per cent savings in cost from the no-stock-out EOQ model. The preceding
can point out the fallacy comparison and conclusion are based on the assumption that the backorder model
in this thinking by noting with an annual cost per back-ordered unit of E30 is a valid model for the actual
that the backorder model
leads to lower inventory inventory situation. However, if the company is concerned that stock-outs might lead
and hence lower to lost sales, then the savings might not be enough to warrant switching to an
inventory holding costs. inventory policy that allowed for planned shortages.
Copyright 2014 Cengage Learning. All Rights Reserved. May not be copied, scanned, or duplicated, in whole or in part. Due to electronic rights, some third party content may be suppressed from the eBook and/or eChapter(s). Editorial review has
deemed that any suppressed content does not materially affect the overall learning experience. Cengage Learning reserves the right to remove additional content at any time if subsequent rights restrictions require it.