
Page 445 -
P. 445
QUANTITY DISCOUNTS FOR THE EOQ MODEL 425
NOTES AND COMMENTS
quation (10.27) shows that the optimal number on a backorder basis. On the other hand, whenever
E of planned backorders S* is proportional to the the backorder cost C b increases, the ratio becomes
ratio C h /(C h + C b ), where C h is the annual holding smaller, and the number of planned backorders
cost per unit and C b is the annual backorder cost per decreases. So, the model provides the intuitive result
unit. Whenever C h increases, this ratio becomes that items with high back-ordering costs will be
larger, and the number of planned backorders handled with few backorders. In fact, with high back-
increases. This relationship explains why items that order costs, the backorder model and the EOQ
have a high per-unit cost and a correspondingly high model with no back-ordering allowed provide similar
annual holding cost are more economically handled inventory policies.
10.5 Quantity Discounts for the EOQ Model
In the quantity discount Quantity discounts occur in numerous situations in which suppliers provide an
model, assumption 4 of incentive for large order quantities by offering a lower purchase cost when items
the EOQ model in Table
10.3 is altered. The cost are ordered in larger quantities. In this section we show how the EOQ model can be
per unit varies depending used when quantity discounts are available.
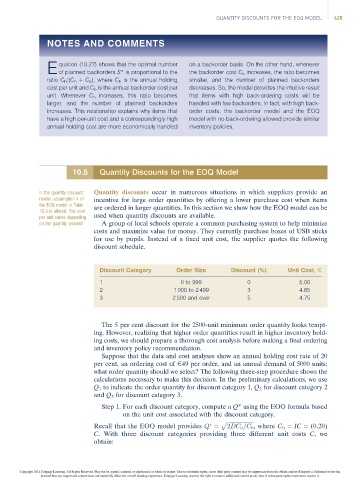
on the quantity ordered. A group of local schools operate a common purchasing system to help minimize
costs and maximize value for money. They currently purchase boxes of USB sticks
for use by pupils. Instead of a fixed unit cost, the supplier quotes the following
discount schedule.
Discount Category Order Size Discount (%) Unit Cost, E
1 0 to 999 0 5.00
2 1 000 to 2 499 3 4.85
3 2 500 and over 5 4.75
The 5 per cent discount for the 2500-unit minimum order quantity looks tempt-
ing. However, realizing that higher order quantities result in higher inventory hold-
ing costs, we should prepare a thorough cost analysis before making a final ordering
and inventory policy recommendation.
Suppose that the data and cost analyses show an annual holding cost rate of 20
per cent, an ordering cost of E49 per order, and an annual demand of 5000 units;
what order quantity should we select? The following three-step procedure shows the
calculations necessary to make this decision. In the preliminary calculations, we use
Q 1 to indicate the order quantity for discount category 1, Q 2 for discount category 2
and Q 3 for discount category 3.
Step 1. For each discount category, compute a Q* using the EOQ formula based
on the unit cost associated with the discount category.
p ffiffiffiffiffiffiffiffiffiffiffiffiffiffiffiffiffiffiffiffi
Recall that the EOQ model provides Q ¼ 2DC o =C h ,where C h ¼ IC ¼ (0.20)
C. With three discount categories providing three different unit costs C,we
obtain:
Copyright 2014 Cengage Learning. All Rights Reserved. May not be copied, scanned, or duplicated, in whole or in part. Due to electronic rights, some third party content may be suppressed from the eBook and/or eChapter(s). Editorial review has
deemed that any suppressed content does not materially affect the overall learning experience. Cengage Learning reserves the right to remove additional content at any time if subsequent rights restrictions require it.