
Page 449 -
P. 449
SINGLE-PERIOD INVENTORY MODEL WITH PROBABILISTIC DEMAND 429
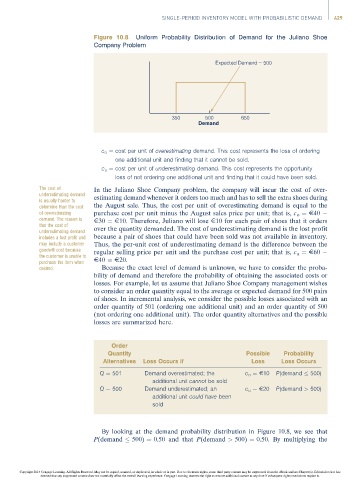
Figure 10.8 Uniform Probability Distribution of Demand for the Juliano Shoe
Company Problem
Expected Demand = 500
350 500 650
Demand
c o ¼ cost per unit of overestimating demand: This cost represents the loss of ordering
one additional unit and finding that it cannot be sold:
c u ¼ cost per unit of underestimating demand: This cost represents the opportunity
loss of not ordering one additional unit and finding that it could have been sold:
The cost of In the Juliano Shoe Company problem, the company will incur the cost of over-
underestimating demand
is usually harder to estimating demand whenever it orders too much and has to sell the extra shoes during
determine than the cost the August sale. Thus, the cost per unit of overestimating demand is equal to the
of overestimating purchase cost per unit minus the August sales price per unit; that is, c o ¼ E40
demand. The reason is E30 ¼ E10. Therefore, Juliano will lose E10 for each pair of shoes that it orders
that the cost of
underestimating demand over the quantity demanded. The cost of underestimating demand is the lost profit
includes a lost profit and because a pair of shoes that could have been sold was not available in inventory.
may include a customer Thus, the per-unit cost of underestimating demand is the difference between the
goodwill cost because regular selling price per unit and the purchase cost per unit; that is, c u ¼ E60
the customer is unable to
purchase the item when E40 ¼ E20.
desired. Because the exact level of demand is unknown, we have to consider the proba-
bility of demand and therefore the probability of obtaining the associated costs or
losses. For example, let us assume that Juliano Shoe Company management wishes
to consider an order quantity equal to the average or expected demand for 500 pairs
of shoes. In incremental analysis, we consider the possible losses associated with an
order quantity of 501 (ordering one additional unit) and an order quantity of 500
(not ordering one additional unit). The order quantity alternatives and the possible
losses are summarized here.
Order
Quantity Possible Probability
Alternatives Loss Occurs if Loss Loss Occurs
Q ¼ 501 Demand overestimated; the c o ¼ E10 P(demand 500)
additional unit cannot be sold
Q ¼ 500 Demand underestimated; an c u ¼ E20 P(demand > 500)
additional unit could have been
sold
By looking at the demand probability distribution in Figure 10.8, we see that
P(demand 500) ¼ 0.50 and that P(demand > 500) ¼ 0.50. By multiplying the
Copyright 2014 Cengage Learning. All Rights Reserved. May not be copied, scanned, or duplicated, in whole or in part. Due to electronic rights, some third party content may be suppressed from the eBook and/or eChapter(s). Editorial review has
deemed that any suppressed content does not materially affect the overall learning experience. Cengage Learning reserves the right to remove additional content at any time if subsequent rights restrictions require it.