
Page 539 -
P. 539
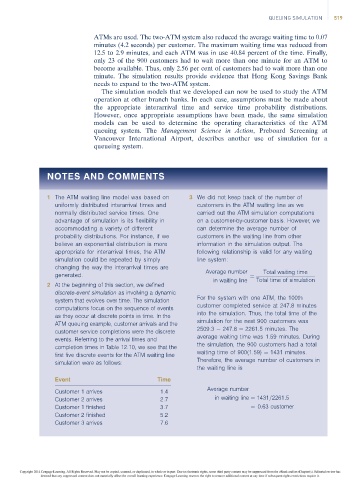
QUEUING SIMULATION  519


                                      ATMs are used. The two-ATM system also reduced the average waiting time to 0.07
                                      minutes (4.2 seconds) per customer. The maximum waiting time was reduced from
                                      12.5 to 2.9 minutes, and each ATM was in use 40.84 percent of the time. Finally,
                                      only 23 of the 900 customers had to wait more than one minute for an ATM to
                                      become available. Thus, only 2.56 per cent of customers had to wait more than one
                                      minute. The simulation results provide evidence that Hong Kong Savings Bank
                                      needs to expand to the two-ATM system.
                                         The simulation models that we developed can now be used to study the ATM
                                      operation at other branch banks. In each case, assumptions must be made about
                                      the appropriate interarrival time and service time probability distributions.
                                      However, once appropriate assumptions have been made, the same simulation
                                      models can be used to determine the operating characteristics of the ATM
                                      queuing system. The Management Science in Action, Preboard Screening at
                                      Vancouver International Airport, describes another use of simulation for a
                                      queueing system.


                        NOTES AND COMMENTS


                        1 The ATM waiting line model was based on   3 We did not keep track of the number of
                          uniformly distributed interarrival times and  customers in the ATM waiting line as we
                          normally distributed service times. One     carried out the ATM simulation computations
                          advantage of simulation is its flexibility in  on a customer-by-customer basis. However, we
                          accommodating a variety of different        can determine the average number of
                          probability distributions. For instance, if we  customers in the waiting line from other
                          believe an exponential distribution is more  information in the simulation output. The
                          appropriate for interarrival times, the ATM  following relationship is valid for any waiting
                          simulation could be repeated by simply      line system:
                          changing the way the interarrival times are
                                                                         Average number   Total waiting time
                          generated.                                                  ¼
                                                                           in waiting line  Total time of simulation
                        2 At the beginning of this section, we defined
                          discrete-event simulation as involving a dynamic
                                                                      For the system with one ATM, the 100th
                          system that evolves over time. The simulation
                                                                      customer completed service at 247.8 minutes
                          computations focus on the sequence of events
                                                                      into the simulation. Thus, the total time of the
                          as they occur at discrete points in time. In the
                                                                      simulation for the next 900 customers was
                          ATM queuing example, customer arrivals and the
                                                                      2509.3   247.8 ¼ 2261.5 minutes. The
                          customer service completions were the discrete
                                                                      average waiting time was 1.59 minutes. During
                          events. Referring to the arrival times and
                                                                      the simulation, the 900 customers had a total
                          completion times in Table 12.10, we see that the
                                                                      waiting time of 900(1.59) ¼ 1431 minutes.
                          first five discrete events for the ATM waiting line
                                                                      Therefore, the average number of customers in
                          simulation were as follows:
                                                                      the waiting line is
                          Event                           Time
                                                                         Average number
                          Customer 1 arrives               1.4
                          Customer 2 arrives               2.7              in waiting line ¼ 1431=2261:5
                          Customer 1 finished              3.7                         ¼ 0:63 customer
                          Customer 2 finished              5.2
                          Customer 3 arrives               7.6


                Copyright 2014 Cengage Learning. All Rights Reserved. May not be copied, scanned, or duplicated, in whole or in part. Due to electronic rights, some third party content may be suppressed from the eBook and/or eChapter(s). Editorial review has
                      deemed that any suppressed content does not materially affect the overall learning experience. Cengage Learning reserves the right to remove additional content at any time if subsequent rights restrictions require it.