
Page 535 -
P. 535
QUEUING SIMULATION 515
Using the totals in Table 12.10, we can calculate an average waiting time for the ten
customers of 11.2/10 ¼ 1.12 minutes, and an average time in the system of 32.1/
10 ¼ 3.21 minutes. Table 12.10 shows that seven of the ten customers had to wait.
The total time for the ten-customer simulation is given by the completion time of the
tenth customer: 26.0 minutes. However, we realize that a simulation for ten custom-
ers is much too short a period to draw any firm conclusions about the operation of
the waiting line.
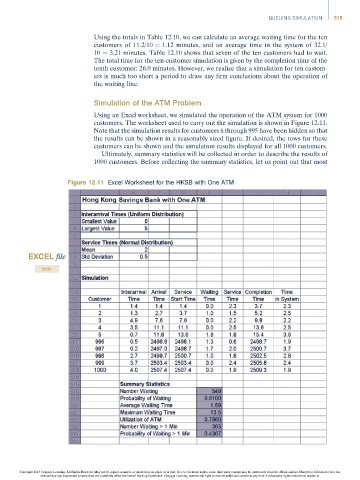
Simulation of the ATM Problem
Using an Excel worksheet, we simulated the operation of the ATM system for 1000
customers. The worksheet used to carry out the simulation is shown in Figure 12.11.
Note that the simulation results for customers 6 through 995 have been hidden so that
the results can be shown in a reasonably sized figure. If desired, the rows for these
customers can be shown and the simulation results displayed for all 1000 customers.
Ultimately, summary statistics will be collected in order to describe the results of
1000 customers. Before collecting the summary statistics, let us point out that most
Figure 12.11 Excel Worksheet for the HKSB with One ATM
EXCEL file
HKSB1
Copyright 2014 Cengage Learning. All Rights Reserved. May not be copied, scanned, or duplicated, in whole or in part. Due to electronic rights, some third party content may be suppressed from the eBook and/or eChapter(s). Editorial review has
deemed that any suppressed content does not materially affect the overall learning experience. Cengage Learning reserves the right to remove additional content at any time if subsequent rights restrictions require it.