Page 532 -
P. 532

512   CHAPTER 12 SIMULATION


                             Figure 12.10 Flowchart of the HKSB ATM Waiting Line Simulation


                                                                Initialize Simulation Model
                                                         i = 0; Arrival Time(0) = 0; Completion Time(0) = 0


                                                                     New Customer
                                                                       i = i + 1


                                                               Generate Interarrival Time (IAT )
                                Next
                              Customer
                                                            Arrival Time( i ) = Arrival Time( i – 1) + IAT


                                                                         Is
                                                      Yes            Arrival Time( i )     No
                                                                 Greater Than Completion
                                                                      Time( i – 1)?


                                                   ATM Idle                               ATM Busy
                                            Customer i can begin service          Customer i must wait for preceding
                                                  immediately.                     customer to complete service.
                                            Start Time( i ) = Arrival Time( i )  Start Time( i ) = Completion Time( i – 1)


                                                          Waiting Time( i ) = Start Time( i ) – Arrival Time( i )


                                                                Generate Service Time (ST )


                                                            Completion Time( i ) = Start Time( i ) + ST

                                                        System Time( i ) = Completion Time( i ) – Arrival Time( i )


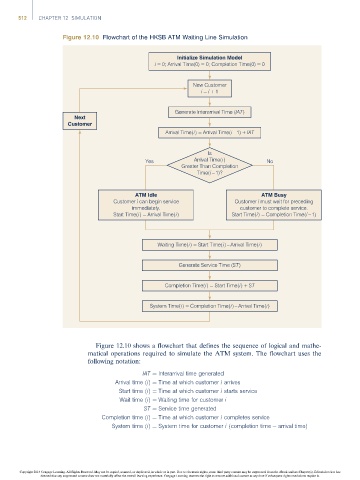
                                       Figure 12.10 shows a flowchart that defines the sequence of logical and mathe-
                                     matical operations required to simulate the ATM system. The flowchart uses the
                                     following notation:

                                                     IAT ¼ Interarrival time generated
                                             Arrival time ðiÞ¼ Time at which customer i arrives
                                              Start time ðiÞ¼ Time at which customer i starts service
                                              Wait time ðiÞ¼ Waiting time for customer i
                                                      ST ¼ Service time generated
                                         Completion time ðiÞ¼ Time at which customer i completes service
                                            System time ðiÞ¼ System time for customer i ðcompletion time   arrival timeÞ


                Copyright 2014 Cengage Learning. All Rights Reserved. May not be copied, scanned, or duplicated, in whole or in part. Due to electronic rights, some third party content may be suppressed from the eBook and/or eChapter(s). Editorial review has
                      deemed that any suppressed content does not materially affect the overall learning experience. Cengage Learning reserves the right to remove additional content at any time if subsequent rights restrictions require it.
   527   528   529   530   531   532   533   534   535   536   537