
Page 528 -
P. 528
508 CHAPTER 12 SIMULATION
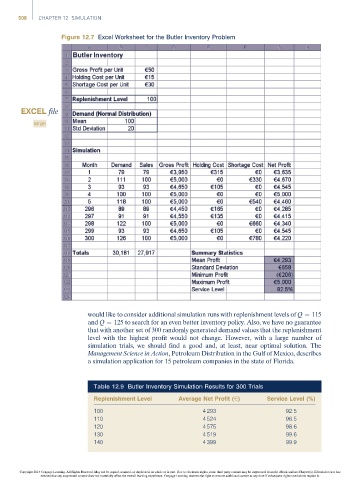
Figure 12.7 Excel Worksheet for the Butler Inventory Problem
EXCEL file
BUTLER
would like to consider additional simulation runs with replenishment levels of Q ¼ 115
and Q ¼ 125 to search for an even better inventory policy. Also, we have no guarantee
that with another set of 300 randomly generated demand values that the replenishment
level with the highest profit would not change. However, with a large number of
simulation trials, we should find a good and, at least, near optimal solution. The
Management Science in Action, Petroleum Distribution in the Gulf of Mexico, describes
a simulation application for 15 petroleum companies in the state of Florida.
Table 12.9 Butler Inventory Simulation Results for 300 Trials
Replenishment Level Average Net Profit (E) Service Level (%)
100 4 293 92.5
110 4 524 96.5
120 4 575 98.6
130 4 519 99.6
140 4 399 99.9
Copyright 2014 Cengage Learning. All Rights Reserved. May not be copied, scanned, or duplicated, in whole or in part. Due to electronic rights, some third party content may be suppressed from the eBook and/or eChapter(s). Editorial review has
deemed that any suppressed content does not materially affect the overall learning experience. Cengage Learning reserves the right to remove additional content at any time if subsequent rights restrictions require it.