
Page 523 -
P. 523
RISK ANALYSIS 503
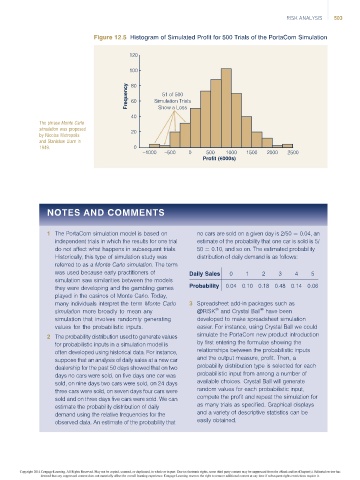
Figure 12.5 Histogram of Simulated Profit for 500 Trials of the PortaCom Simulation
120
100
Frequency 80 Simulation Trials
51 of 500
60
40 Show a Loss
The phrase Monte Carlo
simulation was proposed 20
by Nicolas Metropolis
and Stanislaw Ulam in
1949. 0
1000 500 0 500 1000 1500 2000 2500
Profit (€000s)
NOTES AND COMMENTS
1 The PortaCom simulation model is based on no cars are sold on a given day is 2/50 ¼ 0.04, an
independent trials in which the results for one trial estimate of the probability that one car is sold is 5/
do not affect what happens in subsequent trials. 50 ¼ 0.10, and so on. The estimated probability
Historically, this type of simulation study was distribution of daily demand is as follows:
referred to as a Monte Carlo simulation. The term
was used because early practitioners of Daily Sales 0 1 2 3 4 5
simulation saw similarities between the models
they were developing and the gambling games Probability 0.04 0.10 0.18 0.48 0.14 0.06
played in the casinos of Monte Carlo. Today,
many individuals interpret the term Monte Carlo 3 Spreadsheet add-in packages such as
Ò
Ò
simulation more broadly to mean any @RISK and Crystal Ball have been
simulation that involves randomly generating developed to make spreadsheet simulation
values for the probabilistic inputs. easier. For instance, using Crystal Ball we could
2 The probability distribution used to generate values simulate the PortaCom new product introduction
for probabilistic inputs in a simulation model is by first entering the formulae showing the
often developed using historical data. For instance, relationships between the probabilistic inputs
suppose that an analysis of daily sales at a new car and the output measure, profit. Then, a
dealership for the past 50 days showed that on two probability distribution type is selected for each
days no cars were sold, on five days one car was probabilistic input from among a number of
sold, on nine days two cars were sold, on 24 days available choices. Crystal Ball will generate
three cars were sold, on seven days four cars were random values for each probabilistic input,
compute the profit and repeat the simulation for
sold and on three days five cars were sold. We can
as many trials as specified. Graphical displays
estimate the probability distribution of daily
and a variety of descriptive statistics can be
demand using the relative frequencies for the
easily obtained.
observed data. An estimate of the probability that
Copyright 2014 Cengage Learning. All Rights Reserved. May not be copied, scanned, or duplicated, in whole or in part. Due to electronic rights, some third party content may be suppressed from the eBook and/or eChapter(s). Editorial review has
deemed that any suppressed content does not materially affect the overall learning experience. Cengage Learning reserves the right to remove additional content at any time if subsequent rights restrictions require it.