
Page 520 -
P. 520
500 CHAPTER 12 SIMULATION
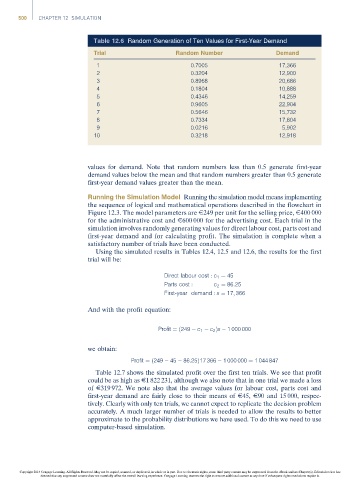
Table 12.6 Random Generation of Ten Values for First-Year Demand
Trial Random Number Demand
1 0.7005 17,366
2 0.3204 12,900
3 0.8968 20,686
4 0.1804 10,888
5 0.4346 14,259
6 0.9605 22,904
7 0.5646 15,732
8 0.7334 17,804
9 0.0216 5,902
10 0.3218 12,918
values for demand. Note that random numbers less than 0.5 generate first-year
demand values below the mean and that random numbers greater than 0.5 generate
first-year demand values greater than the mean.
Running the Simulation Model Running the simulation model means implementing
the sequence of logical and mathematical operations described in the flowchart in
Figure 12.3. The model parameters are E249 per unit for the selling price, E400 000
for the administrative cost and E600 000 for the advertising cost. Each trial in the
simulation involves randomly generating values for direct labour cost, parts cost and
first-year demand and for calculating profit. The simulation is complete when a
satisfactory number of trials have been conducted.
Using the simulated results in Tables 12.4, 12.5 and 12.6, the results for the first
trial will be:
Direct labour cost : c 1 ¼ 45
Parts cost : c 2 ¼ 86:25
First-year demand : x ¼ 17; 366
And with the profit equation:
Profit ¼ð249 c 1 c 2 Þx 1 000 000
we obtain:
Profit ¼ð249 45 86:25Þ17 366 1 000 000 ¼ 1 044 847
Table 12.7 shows the simulated profit over the first ten trials. We see that profit
could be as high as E1 822 231, although we also note that in one trial we made a loss
of E319 972. We note also that the average values for labour cost, parts cost and
first-year demand are fairly close to their means of E45, E90 and 15 000, respec-
tively. Clearly with only ten trials, we cannot expect to replicate the decision problem
accurately. A much larger number of trials is needed to allow the results to better
approximate to the probability distributions we have used. To do this we need to use
computer-based simulation.
Copyright 2014 Cengage Learning. All Rights Reserved. May not be copied, scanned, or duplicated, in whole or in part. Due to electronic rights, some third party content may be suppressed from the eBook and/or eChapter(s). Editorial review has
deemed that any suppressed content does not materially affect the overall learning experience. Cengage Learning reserves the right to remove additional content at any time if subsequent rights restrictions require it.