
Page 519 -
P. 519
RISK ANALYSIS 499
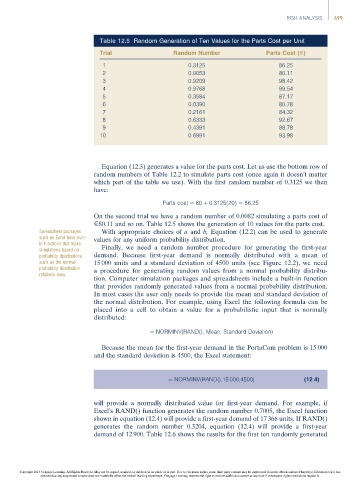
Table 12.5 Random Generation of Ten Values for the Parts Cost per Unit
Trial Random Number Parts Cost (E)
1 0.3125 86.25
2 0.0053 80.11
3 0.9209 98.42
4 0.9768 99.54
5 0.3584 87.17
6 0.0390 80.78
7 0.2161 84.32
8 0.6333 92.67
9 0.4391 88.78
10 0.6991 93.98
Equation (12.3) generates a value for the parts cost. Let us use the bottom row of
random numbers of Table 12.2 to simulate parts cost (once again it doesn’t matter
which part of the table we use). With the first random number of 0.3125 we then
have:
Parts cost ¼ 80 þ 0:3125ð20Þ¼ 86:25
On the second trial we have a random number of 0.0082 simulating a parts cost of
E80.11 and so on. Table 12.5 shows the generation of 10 values for the parts cost.
Spreadsheet packages With appropriate choices of a and b, Equation (12.2) can be used to generate
such as Excel have built- values for any uniform probability distribution.
in functions that make
simulations based on Finally, we need a random number procedure for generating the first-year
probability distributions demand. Because first-year demand is normally distributed with a mean of
such as the normal 15 000 units and a standard deviation of 4500 units (see Figure 12.2), we need
probability distribution a procedure for generating random values from a normal probability distribu-
relatively easy.
tion. Computer simulation packages and spreadsheets include a built-in function
that provides randomly generated values from a normal probability distribution.
In most cases the user only needs to provide the mean and standard deviation of
the normal distribution. For example, using Excel the following formula can be
placed into a cell to obtain a value for a probabilistic input that is normally
distributed:
¼ NORMINV(RAND(), Mean, Standard Deviation)
Because the mean for the first-year demand in the PortaCom problem is 15 000
and the standard deviation is 4500, the Excel statement:
¼ NORMINV(RAND(),15 000,4500) (12:4)
will provide a normally distributed value for first-year demand. For example, if
Excel’s RAND() function generates the random number 0.7005, the Excel function
shown in equation (12.4) will provide a first-year demand of 17 366 units. If RAND()
generates the random number 0.3204, equation (12.4) will provide a first-year
demand of 12 900. Table 12.6 shows the results for the first ten randomly generated
Copyright 2014 Cengage Learning. All Rights Reserved. May not be copied, scanned, or duplicated, in whole or in part. Due to electronic rights, some third party content may be suppressed from the eBook and/or eChapter(s). Editorial review has
deemed that any suppressed content does not materially affect the overall learning experience. Cengage Learning reserves the right to remove additional content at any time if subsequent rights restrictions require it.