
Page 515 -
P. 515
RISK ANALYSIS 495
To simulate the PortaCom problem, we must generate values for the three
variables and calculate the resulting profit. Then, we generate another set of values
for the variables, calculate a second value for profit and so on. We continue this
process until we are satisfied that enough trials have been conducted to describe the
probability distribution for profit. This process is called simulation. In effect we are
simulating what could happen in real life by using the information we have about the
problem, selecting likely values for the three variables and assessing the effect on
profit. If we do this a large number of times (by conducting simulation trials) then
we should get a good approximation of what might happen if we were to do this for
real. The sequence of logical and mathematical operations required to conduct a
simulation can be depicted with a flowchart. A flowchart for the PortaCom simu-
A flowchart provides a lation is shown in Figure 12.3.
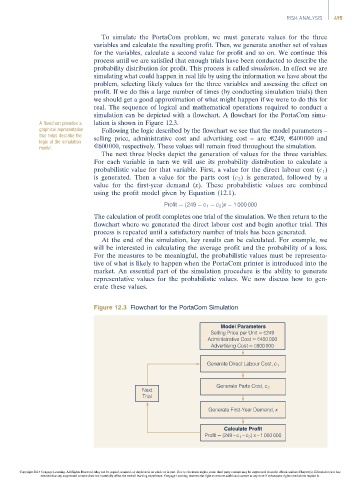
graphical representation Following the logic described by the flowchart we see that the model parameters –
that helps describe the selling price, administrative cost and advertising cost – are E249, E400 000 and
logic of the simulation
model. E600 000, respectively. These values will remain fixed throughout the simulation.
The next three blocks depict the generation of values for the three variables.
Foreachvariableinturnwewilluse itsprobability distribution to calculate a
probabilistic value for that variable. First, a value for the direct labour cost (c 1 )
is generated. Then a value for the parts cost (c 2 ) is generated, followed by a
value for the first-year demand (x). These probabilistic values are combined
using the profit model given by Equation (12.1).
Profit ¼ð249 c 1 c 2 Þx 1 000 000
The calculation of profit completes one trial of the simulation. We then return to the
flowchart where we generated the direct labour cost and begin another trial. This
process is repeated until a satisfactory number of trials has been generated.
At the end of the simulation, key results can be calculated. For example, we
will be interested in calculating the average profit and the probability of a loss.
For the measures to be meaningful, the probabilistic values must be representa-
tive of what is likely to happen when the PortaCom printer is introduced into the
market. An essential part of the simulation procedure is the ability to generate
representative values for the probabilistic values. We now discuss how to gen-
erate these values.
Figure 12.3 Flowchart for the PortaCom Simulation
Model Parameters
Selling Price per Unit = €249
Administrative Cost = €400 000
Advertising Cost = €600 000
Generate Direct Labour Cost, c 1
Generate Parts Cost, c 2
Next
Trial
Generate First-Year Demand, x
Calculate Profit
Profit = (249 – c 1 – c 2 ) x – 1 000 000
Copyright 2014 Cengage Learning. All Rights Reserved. May not be copied, scanned, or duplicated, in whole or in part. Due to electronic rights, some third party content may be suppressed from the eBook and/or eChapter(s). Editorial review has
deemed that any suppressed content does not materially affect the overall learning experience. Cengage Learning reserves the right to remove additional content at any time if subsequent rights restrictions require it.