Page 514 -
P. 514

494   CHAPTER 12 SIMULATION


                                      Table 12.1 Probability Distribution for Direct Labour Cost per Unit
                                      Direct Labour Cost per Unit                          Probability
                                      E43                                                      0.1
                                      E44                                                      0.2
                                      E45                                                      0.4
                                      E46                                                      0.2
                                      E47                                                      0.1


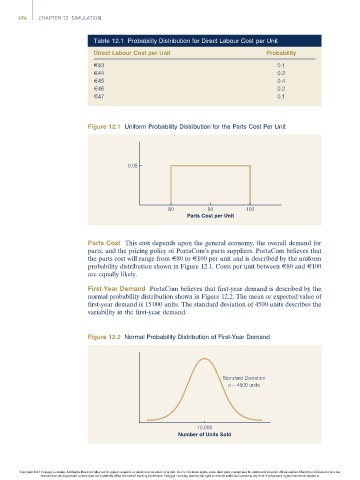
                                     Figure 12.1 Uniform Probability Distribution for the Parts Cost Per Unit


                                                 0.05


                                                             80          90          100
                                                                   Parts Cost per Unit


                                     Parts Cost This cost depends upon the general economy, the overall demand for
                                     parts, and the pricing policy of PortaCom’s parts suppliers. PortaCom believes that
                                     the parts cost will range from E80 to E100 per unit and is described by the uniform
                                     probability distribution shown in Figure 12.1. Costs per unit between E80 and E100
                                     are equally likely.
                                     First-Year Demand PortaCom believes that first-year demand is described by the
                                     normal probability distribution shown in Figure 12.2. The mean or expected value of
                                     first-year demand is 15 000 units. The standard deviation of 4500 units describes the
                                     variability in the first-year demand.


                                     Figure 12.2 Normal Probability Distribution of First-Year Demand


                                                                              Standard Deviation
                                                                                 = 4500 units


                                                                      15,000
                                                                Number of Units Sold


                Copyright 2014 Cengage Learning. All Rights Reserved. May not be copied, scanned, or duplicated, in whole or in part. Due to electronic rights, some third party content may be suppressed from the eBook and/or eChapter(s). Editorial review has
                      deemed that any suppressed content does not materially affect the overall learning experience. Cengage Learning reserves the right to remove additional content at any time if subsequent rights restrictions require it.
   509   510   511   512   513   514   515   516   517   518   519