
Page 521 -
P. 521
RISK ANALYSIS 501
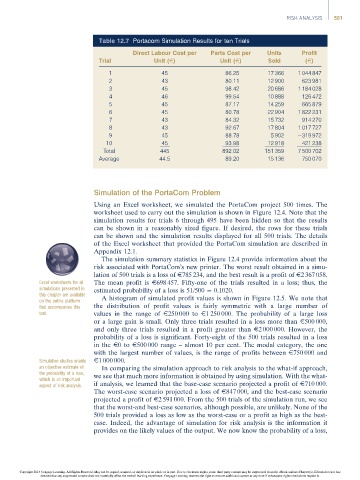
Table 12.7 Portacom Simulation Results for ten Trials
Direct Labour Cost per Parts Cost per Units Profit
Trial Unit (E) Unit (E) Sold (E)
1 45 86.25 17 366 1 044 847
2 43 80.11 12 900 623 981
3 45 98.42 20 686 1 184 028
4 46 99.54 10 888 126 472
5 45 87.17 14 259 665 879
6 45 80.78 22 904 1 822 231
7 43 84.32 15 732 914 270
8 43 92.67 17 804 1 017 727
9 45 88.78 5 902 319 972
10 45 93.98 12 918 421 238
Total 445 892.02 151 359 7 500 702
Average 44.5 89.20 15 136 750 070
Simulation of the PortaCom Problem
Usingan Excelworksheet,wesimulated thePortaComproject 500 times. The
worksheet used to carry out the simulation is shown in Figure 12.4. Note that the
simulation results for trials 6 through 495 have been hidden so that the results
can be shown in a reasonably sized figure. If desired, the rows for these trials
can be shown and the simulation results displayed for all 500 trials. The details
of the Excel worksheet that provided the PortaCom simulation are described in
Appendix 12.1.
The simulation summary statistics in Figure 12.4 provide information about the
risk associated with PortaCom’s new printer. The worst result obtained in a simu-
lation of 500 trials is a loss of E785 234, and the best result is a profit of E2 367 058.
Excel worksheets for all The mean profit is E698 457. Fifty-one of the trials resulted in a loss; thus, the
simulations presented in estimated probability of a loss is 51/500 ¼ 0.1020.
this chapter are available
on the online platform A histogram of simulated profit values is shown in Figure 12.5. We note that
that accompanies this the distribution of profit values is fairly symmetric with a large number of
text. values in the range of E250 000 to E1 250 000. The probability of a large loss
or a large gain is small. Only three trials resulted in a loss more than E500 000,
and only three trials resulted in a profit greater than E2 000 000. However, the
probability of a loss is significant. Forty-eight of the 500 trials resulted in a loss
in the E0to E500 000 range – almost 10 per cent. The modal category, the one
with the largest number of values, is the range of profits between E750 000 and
Simulation studies enable E1 000 000.
an objective estimate of In comparing the simulation approach to risk analysis to the what-if approach,
the probability of a loss, we see that much more information is obtained by using simulation. With the what-
which is an important
aspect of risk analysis. if analysis, we learned that the base-case scenario projected a profit of E710 000.
Theworst-casescenarioprojected alossof E847 000, and the best-case scenario
projected a profit of E2 591 000. From the 500 trials of the simulation run, we see
that the worst-and best-case scenarios, although possible, are unlikely. None of the
500 trials provided a loss as low as the worst-case or a profit as high as the best-
case. Indeed, the advantage of simulation for risk analysis is the information it
provides on the likely values of the output. We now know the probability of a loss,
Copyright 2014 Cengage Learning. All Rights Reserved. May not be copied, scanned, or duplicated, in whole or in part. Due to electronic rights, some third party content may be suppressed from the eBook and/or eChapter(s). Editorial review has
deemed that any suppressed content does not materially affect the overall learning experience. Cengage Learning reserves the right to remove additional content at any time if subsequent rights restrictions require it.