
Page 526 -
P. 526
506 CHAPTER 12 SIMULATION
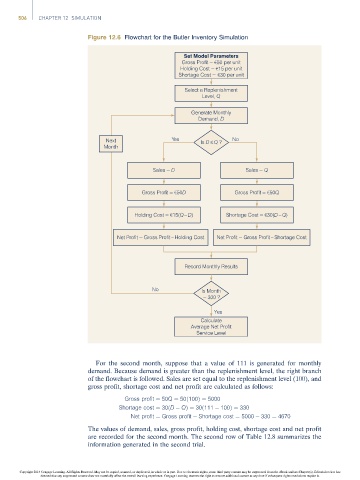
Figure 12.6 Flowchart for the Butler Inventory Simulation
Set Model Parameters
Gross Profit = €50 per unit
Holding Cost = €15 per unit
Shortage Cost = €30 per unit
Select a Replenishment
Level, Q
Generate Monthly
Demand, D
Next Yes Is D Q ? No
Month
Sales = D Sales = Q
Gross Profit = €50D Gross Profit = €50Q
Holding Cost = €15(Q – D) Shortage Cost = €30(D – Q)
Net Profit = Gross Profit – Holding Cost Net Profit = Gross Profit – Shortage Cost
Record Monthly Results
No Is Month
= 300 ?
Yes
Calculate
Average Net Profit
Service Level
For the second month, suppose that a value of 111 is generated for monthly
demand. Because demand is greater than the replenishment level, the right branch
of the flowchart is followed. Sales are set equal to the replenishment level (100), and
gross profit, shortage cost and net profit are calculated as follows:
Gross profit ¼ 50Q ¼ 50ð100Þ¼ 5000
Shortage cost ¼ 30ðD QÞ¼ 30ð111 100Þ¼ 330
Net profit ¼ Gross profit Shortage cost ¼ 5000 330 ¼ 4670
The values of demand, sales, gross profit, holding cost, shortage cost and net profit
are recorded for the second month. The second row of Table 12.8 summarizes the
information generated in the second trial.
Copyright 2014 Cengage Learning. All Rights Reserved. May not be copied, scanned, or duplicated, in whole or in part. Due to electronic rights, some third party content may be suppressed from the eBook and/or eChapter(s). Editorial review has
deemed that any suppressed content does not materially affect the overall learning experience. Cengage Learning reserves the right to remove additional content at any time if subsequent rights restrictions require it.