
Page 536 -
P. 536
516 CHAPTER 12 SIMULATION
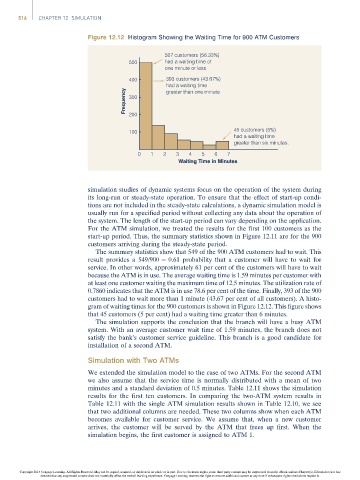
Figure 12.12 Histogram Showing the Waiting Time for 900 ATM Customers
507 customers (56.33%)
500 had a waiting time of
one minute or less.
400 393 customers (43.67%)
had a waiting time
Frequency 300
greater than one minute.
200
100 45 customers (5%)
had a waiting time
greater than six minutes.
0 1 2 3 4 5 6 7
Waiting Time in Minutes
simulation studies of dynamic systems focus on the operation of the system during
its long-run or steady-state operation. To ensure that the effect of start-up condi-
tions are not included in the steady-state calculations, a dynamic simulation model is
usually run for a specified period without collecting any data about the operation of
the system. The length of the start-up period can vary depending on the application.
For the ATM simulation, we treated the results for the first 100 customers as the
start-up period. Thus, the summary statistics shown in Figure 12.11 are for the 900
customers arriving during the steady-state period.
The summary statistics show that 549 of the 900 ATM customers had to wait. This
result provides a 549/900 ¼ 0.61 probability that a customer will have to wait for
service. In other words, approximately 61 per cent of the customers will have to wait
because the ATM is in use. The average waiting time is 1.59 minutes per customer with
at least one customer waiting the maximum time of 12.5 minutes. The utilization rate of
0.7860 indicates that the ATM is in use 78.6 per cent of the time. Finally, 393 of the 900
customers had to wait more than 1 minute (43.67 per cent of all customers). A histo-
gram of waiting times for the 900 customers is shown in Figure 12.12. This figure shows
that 45 customers (5 per cent) had a waiting time greater than 6 minutes.
The simulation supports the conclusion that the branch will have a busy ATM
system. With an average customer wait time of 1.59 minutes, the branch does not
satisfy the bank’s customer service guideline. This branch is a good candidate for
installation of a second ATM.
Simulation with Two ATMs
We extended the simulation model to the case of two ATMs. For the second ATM
we also assume that the service time is normally distributed with a mean of two
minutes and a standard deviation of 0.5 minutes. Table 12.11 shows the simulation
results for the first ten customers. In comparing the two-ATM system results in
Table 12.11 with the single ATM simulation results shown in Table 12.10, we see
that two additional columns are needed. These two columns show when each ATM
becomes available for customer service. We assume that, when a new customer
arrives, the customer will be served by the ATM that frees up first. When the
simulation begins, the first customer is assigned to ATM 1.
Copyright 2014 Cengage Learning. All Rights Reserved. May not be copied, scanned, or duplicated, in whole or in part. Due to electronic rights, some third party content may be suppressed from the eBook and/or eChapter(s). Editorial review has
deemed that any suppressed content does not materially affect the overall learning experience. Cengage Learning reserves the right to remove additional content at any time if subsequent rights restrictions require it.