
Page 538 -
P. 538
518 CHAPTER 12 SIMULATION
Customer 8
l An interarrival time of 0.3 minute is generated, and customer 8 arrives
11.0 þ 0.3 ¼ 11.3 minutes into the simulation.
l From the previous row, we see that ATM 1 will be the first available. So
customer 8 starts service on ATM 1 at 12.0 minutes resulting in a waiting time
of 12.0 11.3 ¼ 0.7 minute.
l A service time of 2.2 minutes is generated resulting in a completion time of
12.0 þ 2.2 ¼ 14.2 minutes and a system time of 0.7 þ 2.2 ¼ 2.9 minutes.
l The time available for ATM 1 is updated to 14.2 minutes, and the time
available for ATM 2 remains at 12.0 minutes.
Worksheets for the one-
ATM and two-ATM From the totals in Table 12.11, we see that the average waiting time for these ten
systems are available on
the online platform that customers is only 1.0/10 ¼ 0.1 minute. Of course, a much longer simulation will be
accompanies this text. necessary before any conclusions can be drawn.
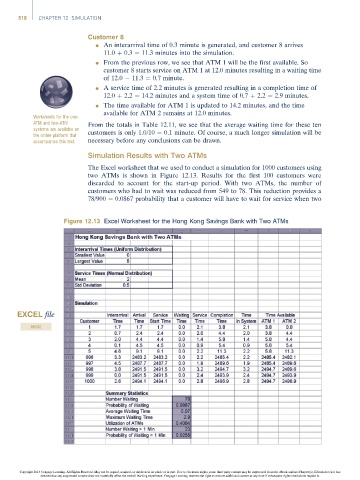
Simulation Results with Two ATMs
The Excel worksheet that we used to conduct a simulation for 1000 customers using
two ATMs is shown in Figure 12.13. Results for the first 100 customers were
discarded to account for the start-up period. With two ATMs, the number of
customers who had to wait was reduced from 549 to 78. This reduction provides a
78/900 ¼ 0.0867 probability that a customer will have to wait for service when two
Figure 12.13 Excel Worksheet for the Hong Kong Savings Bank with Two ATMs
EXCEL file
HKSB2
Copyright 2014 Cengage Learning. All Rights Reserved. May not be copied, scanned, or duplicated, in whole or in part. Due to electronic rights, some third party content may be suppressed from the eBook and/or eChapter(s). Editorial review has
deemed that any suppressed content does not materially affect the overall learning experience. Cengage Learning reserves the right to remove additional content at any time if subsequent rights restrictions require it.