
Page 78 -
P. 78
58 CHAPTER 2 AN INTRODUCTION TO LINEAR PROGRAMMING
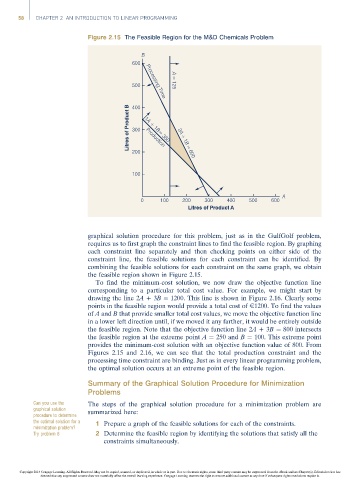
Figure 2.15 The Feasible Region for the M&D Chemicals Problem
B
600
500 Processing Time A = 125
Litres of Product B 400 1A + 1B= 350
300
Production
200 2A + 1B = 600
100
A
0 100 200 300 400 500 600
Litres of Product A
graphical solution procedure for this problem, just as in the GulfGolf problem,
requires us to first graph the constraint lines to find the feasible region. By graphing
each constraint line separately and then checking points on either side of the
constraint line, the feasible solutions for each constraint can be identified. By
combining the feasible solutions for each constraint on the same graph, we obtain
the feasible region shown in Figure 2.15.
To find the minimum-cost solution, we now draw the objective function line
corresponding to a particular total cost value. For example, we might start by
drawing the line 2A +3B ¼ 1200. This line is shown in Figure 2.16. Clearly some
points in the feasible region would provide a total cost of E1200. To find the values
of A and B that provide smaller total cost values, we move the objective function line
in a lower left direction until, if we moved it any farther, it would be entirely outside
the feasible region. Note that the objective function line 2A +3B ¼ 800 intersects
the feasible region at the extreme point A ¼ 250 and B ¼ 100. This extreme point
provides the minimum-cost solution with an objective function value of 800. From
Figures 2.15 and 2.16, we can see that the total production constraint and the
processing time constraint are binding. Just as in every linear programming problem,
the optimal solution occurs at an extreme point of the feasible region.
Summary of the Graphical Solution Procedure for Minimization
Problems
Can you use the The steps of the graphical solution procedure for a minimization problem are
graphical solution summarized here:
procedure to determine
the optimal solution for a 1 Prepare a graph of the feasible solutions for each of the constraints.
minimization problem?
Try problem 8 2 Determine the feasible region by identifying the solutions that satisfy all the
constraints simultaneously.
Copyright 2014 Cengage Learning. All Rights Reserved. May not be copied, scanned, or duplicated, in whole or in part. Due to electronic rights, some third party content may be suppressed from the eBook and/or eChapter(s). Editorial review has
deemed that any suppressed content does not materially affect the overall learning experience. Cengage Learning reserves the right to remove additional content at any time if subsequent rights restrictions require it.