
Page 279 - Analysis and Design of Energy Geostructures
P. 279
254 Analysis and Design of Energy Geostructures
Figure 5.40 Sand concrete interface (high roughness) response subjected to cyclic shearing at
20 C and 60 C under constant normal load conditions. Redrawn after Di Donna, A., Ferrari, A.,
Laloui, L., 2015. Experimental investigations of the soil concrete interface: physical mechanisms, cyclic
mobilisation and behaviour at different temperatures. Can. Geotech. J. 53 (4), 659 672.
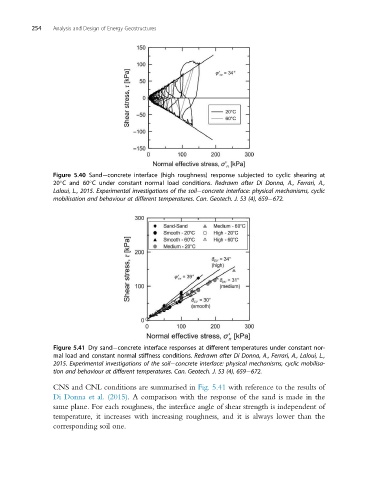
Figure 5.41 Dry sand concrete interface responses at different temperatures under constant nor-
mal load and constant normal stiffness conditions. Redrawn after Di Donna, A., Ferrari, A., Laloui, L.,
2015. Experimental investigations of the soil concrete interface: physical mechanisms, cyclic mobilisa-
tion and behaviour at different temperatures. Can. Geotech. J. 53 (4), 659 672.
CNS and CNL conditions are summarised in Fig. 5.41 with reference to the results of
Di Donna et al. (2015). A comparison with the response of the sand is made in the
same plane. For each roughness, the interface angle of shear strength is independent of
temperature, it increases with increasing roughness, and it is always lower than the
corresponding soil one.