
Page 303 - Analysis and Design of Machine Elements
P. 303
281
Steps Computation Results Shafts Units
(3) Bending Produce bending moment diagrams to determine the M = 165 999 Nmm
H
moment distribution of bending moments in the shaft. M = 174 830 Nmm
diagram and Moment in horizontal plane V1 Nmm
torque diagram M = 165 999 N mm M V2 = 8576 Nmm
of the shaft H M = 241 083 Nmm
1
Moment in vertical plane
M = 166 220 Nmm
2
M V1 = 174 830 N mm, M V2 = 8576 N mm T = 756 000
Total moment M
√
2
2
M = 165999 + 174830 = 241083 N •mm
1
√
2
2
M = 165999 + 8576 = 166220N •mm
2
Torque T
T = 756 000 N mm
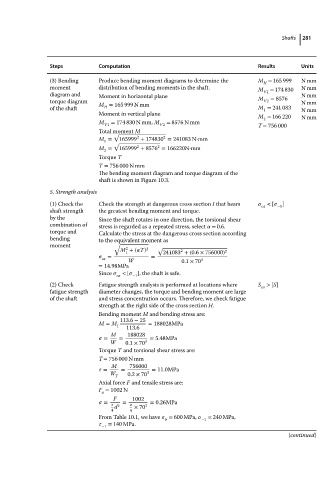
The bending moment diagram and torque diagram of the
shaft is shown in Figure 10.3.
5. Strength analysis
(1) Check the Check the strength at dangerous cross section I that bears < [ ]
ca −1
shaft strength the greatest bending moment and torque.
by the Since the shaft rotates in one direction, the torsional shear
combination of stress is regarded as a repeated stress, select = 0.6.
torque and Calculate the stress at the dangerous cross section according
bending to the equivalent moment as
moment √
2
M +( T) 2 √ 2 2
1 241083 +(0.6 × 756000)
= =
ca
W 0.1 × 70 3
= 14.98MPa
Since < [ ], the shaft is safe.
ca
−1
(2) Check Fatigue strength analysis is performed at locations where S > [S]
ca
fatigue strength diameter changes, the torque and bending moment are large
of the shaft and stress concentration occurs. Therefore, we check fatigue
strength at the right side of the cross section H.
Bending moment M and bending stress are:
113.6 − 25
M = M = 188028MPa
1 113.6
M 188028
= = = 5.48MPa
W 0.1 × 70 3
Torque T and torsional shear stress are:
T = 756 000 N mm
M 756000
= = = 11.0MPa
W 0.2 × 70 3
T
Axial force F and tensile stress are:
F = 1002 N
a
F 1002
= = = 0.26MPa
d 2 × 70 2
4 4
From Table 10.1, we have = 600 MPa, −1 = 240 MPa,
b
−1 = 140 MPa.
(continued)