
Page 183 - Analysis, Synthesis and Design of Chemical Processes, Third Edition
P. 183
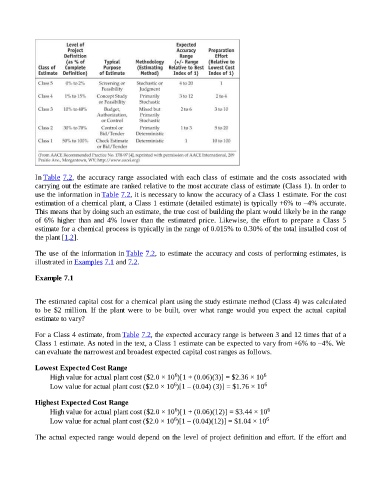
In Table 7.2, the accuracy range associated with each class of estimate and the costs associated with
                    carrying out the estimate are ranked relative to the most accurate class of estimate (Class 1). In order to
                    use the information in Table 7.2, it is necessary to know the accuracy of a Class 1 estimate. For the cost
                    estimation of a chemical plant, a Class 1 estimate (detailed estimate) is typically +6% to –4% accurate.
                    This means that by doing such an estimate, the true cost of building the plant would likely be in the range
                    of  6%  higher  than  and  4%  lower  than  the  estimated  price.  Likewise,  the  effort  to  prepare  a  Class  5
                    estimate for a chemical process is typically in the range of 0.015% to 0.30% of the total installed cost of

                    the plant [1,2].

                    The use of the information in Table 7.2, to estimate the accuracy and costs of performing estimates, is

                    illustrated in Examples 7.1 and 7.2.

                    Example 7.1


                    The estimated capital cost for a chemical plant using the study estimate method (Class 4) was calculated
                    to  be  $2  million.  If  the  plant  were  to  be  built,  over  what  range  would  you  expect  the  actual  capital
                    estimate to vary?


                    For a Class 4 estimate, from Table 7.2, the expected accuracy range is between 3 and 12 times that of a
                    Class 1 estimate. As noted in the text, a Class 1 estimate can be expected to vary from +6% to –4%. We
                    can evaluate the narrowest and broadest expected capital cost ranges as follows.


                    Lowest Expected Cost Range
                                                                          6
                          High value for actual plant cost ($2.0 × 10 )[1 + (0.06)(3)] = $2.36 × 10         6
                                                                          6
                          Low value for actual plant cost ($2.0 × 10 )[1 – (0.04) (3)] = $1.76 × 10          6

                    Highest Expected Cost Range
                                                                          6
                          High value for actual plant cost ($2.0 × 10 )[1 + (0.06)(12)] = $3.44 × 10          6
                                                                          6
                          Low value for actual plant cost ($2.0 × 10 )[1 – (0.04)(12)] = $1.04 × 10          6

                    The actual expected range would depend on the level of project definition and effort. If the effort and