
Page 246 - Analysis, Synthesis and Design of Chemical Processes, Third Edition
P. 246
a. Yearly cost of toluene = (24)(365)(10,000)(0.648)(0.95) = $53,927,000/yr.
b. Yearly consumption of toluene = (24)(365)(10,000)(0.95) / 1000 = 83,200 tonne/yr.
c. Yearly revenue from benzene sales = (24)(365)(8210)(0.657)(0.95) = $44,889,000/yr.
Comparing the results from Parts (a) and (c), we can see that with the current prices for these two
chemicals it is not economical to produce benzene from toluene. Historically, the price differential
between benzene and toluene has been greater than the $0.009/kg shown in Table 8.4, and this is the
reason why this process has been used, and is currently being used, to produce benzene. Clearly, if this
low price differential were to exist for a long period of time, this process might have to be shut down.
8.6 Estimating Utility Costs from the PFD
Most often, utilities do not directly contact process streams. Instead, they exchange heat energy (fuel gas,
steam, cooling water, and boiler feed water) in equipment such as heat exchangers and process heaters, or
they supply work (electric power or steam) to pumps, compressors, and other rotating equipment. In most
cases, the flowrate can be found either by inspection or by doing a simple heat balance around the
equipment.
Steam can be used to drive a piece of rotating equipment such as a compressor. In this case, both the
theoretical steam requirement and efficiency are required. Table 8.5 provides the theoretical steam
requirements as a function of the steam inlet pressure and the exhaust pressure for steam turbine drives.
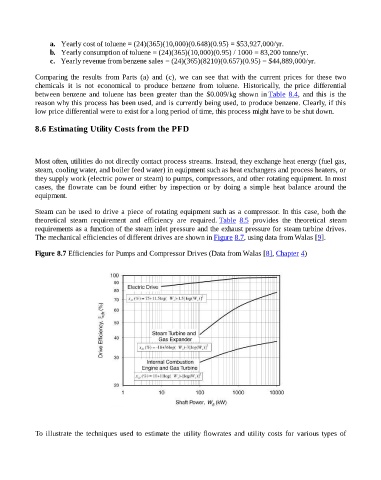
The mechanical efficiencies of different drives are shown in Figure 8.7, using data from Walas [9].
Figure 8.7 Efficiencies for Pumps and Compressor Drives (Data from Walas [8], Chapter 4)
To illustrate the techniques used to estimate the utility flowrates and utility costs for various types of