
Page 38 - Analytical Electrochemistry 2d Ed - Jospeh Wang
P. 38
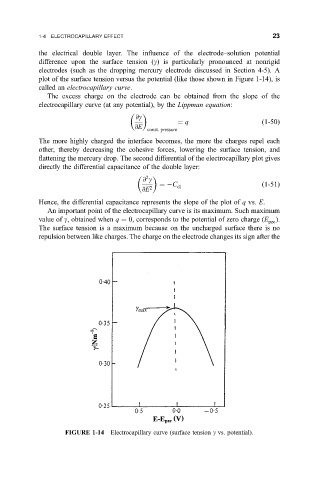
1-4 ELECTROCAPILLARY EFFECT 23
the electrical double layer. The in¯uence of the electrode±solution potential
difference upon the surface tension (g) is particularly pronounced at nonrigid
electrodes (such as the dropping mercury electrode discussed in Section 4-5). A
plot of the surface tension versus the potential (like those shown in Figure 1-14), is
called an electrocapillary curve.
The excess charge on the electrode can be obtained from the slope of the
electrocapillary curve (at any potential), by the Lippman equation:
@g
q
1-50
@E
const: pressure
The more highly charged the interface becomes, the more the charges repel each
other, thereby decreasing the cohesive forces, lowering the surface tension, and
¯attening the mercury drop. The second differential of the electrocapillary plot gives
directly the differential capacitance of the double layer:
@ g
2
C dl
1-51
@E 2
Hence, the differential capacitance represents the slope of the plot of q vs. E.
An important point of the electrocapillary curve is its maximum. Such maximum
value of g, obtained when q 0, corresponds to the potential of zero charge (E ).
pzc
The surface tension is a maximum because on the uncharged surface there is no
repulsion between like charges. The charge on the electrode changes its sign after the
FIGURE 1-14 Electrocapillary curve (surface tension g vs. potential).